6.5 Prepared Consumer Foods
6.5 Prepared Consumer Foods
Prepared Consumer Foods (PCF) are value-added food and beverage products, which sell both domestically and internationally to retail, food service or other food companies. These goods are categorised into 15 areas identified and agreed by industry stakeholders, the Department of Agriculture, Food and the Marine and the Central Statistics Office.
Exports in the PCF sector broke the €3 billion mark for the first time in 2022 with a total of €3.2 billion. Ireland imported €4.2 billion worth of PCF products, resulting in a trade deficit of €1 billion, a 28% increase on the previous year.
4,500
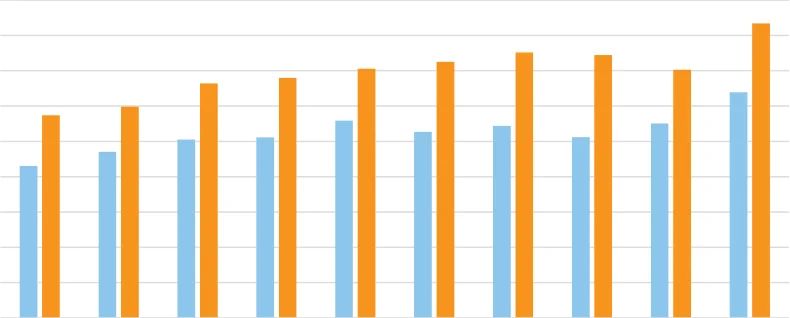
Figure 6.13 Global PCF Exports & Imports by Value, 2013-2022
4,000
3,500
3,000
Millions €
2,500
2,000
1,500
1,000
500
0
2013 2014 2015 2016 2017 2018 2019 2020 2021 2022
Exports €m Imports €m
Source: CSO
The export value of all PCF product categories increased in 2022, with the total growing from €2.8 billion to €3.2 billion (+16%). Meat preparations was the largest category of export overall, increasing from €901 million to €1.1 billion (+19%) in 2022. Cereal-based products saw the largest percentage increase, growing from €99 million to €134 million (+35%).
While no product saw a decrease in export value, there were notable decreases in the volume of other food preparations and dairy preparations, which decreased by 20,000 tonnes (-20%) and 3,300 tonnes (-10%) respectively.
The top five Prepared Consumer Food categories are meat preparations, other food preparations, chocolate-based products, pizza/quiche and waters & juices & soft drinks, accounting for €2.2 billion or 69% of total exports by value in 2022.
Table 6.4 Prepared Consumer Food Exports by Category, 2021-2022
| 2021 2022 Exports Exports | ||||||
|---|---|---|---|---|---|---|
| Category | €000 | Tonnes | €000 | Tonnes | % Value Change | % Volume Change |
| Meat Preparations | 900,565 | 149,792 | 1,065,984 | 160,816 | 18% | 7% |
| Other Food Preparations | 308,492 | 102,834 | 331,469 | 82,756 | 7% | -20% |
| Chocolate-based products | 309,816 | 65,356 | 326,402 | 63,759 | 5% | -2% |
| Pizza/Quiche | 193,777 | 85,745 | 240,203 | 88,178 | 24% | 3% |
| Waters & Juices & Soft Drinks | 212,466 | 245,599 | 237,025 | 272,937 | 12% | 11% |
| Extracts, Sauces, Soups | 178,236 | 24,810 | 214,879 | 26,270 | 21% | 6% |
| Breads | 163,237 | 77,349 | 202,123 | 81,459 | 24% | 5% |
| Dairy Preparations | 108,925 | 33,623 | 135,892 | 30,306 | 25% | -10% |
| Cereal based Products | 99,416 | 131,828 | 133,584 | 151,590 | 34% | 15% |
| Sugar-based products | 108,154 | 34,015 | 120,520 | 32,414 | 11% | -5% |
| Fruit & Vegetable based | 68,023 | 30,350 | 71,688 | 32,552 | 5% | 7% |
| Fruit-based bakery | 66,270 | 19,212 | 71,004 | 20,110 | 7% | 5% |
| Frozen Confectionery | 17,957 | 7,091 | 23,465 | 7,755 | 31% | 9% |
| Biscuits | 13,025 | 3,689 | 14,223 | 3,658 | 9% | -1% |
| Savoury Snacks etc | 6,110 | 2,651 | 6,657 | 2,555 | 9% | -4% |
| Grand Total | 2,754,468 | 1,013,943 | 3,195,117 | 1,057,116 | 16% | 4% |
Source: CSO
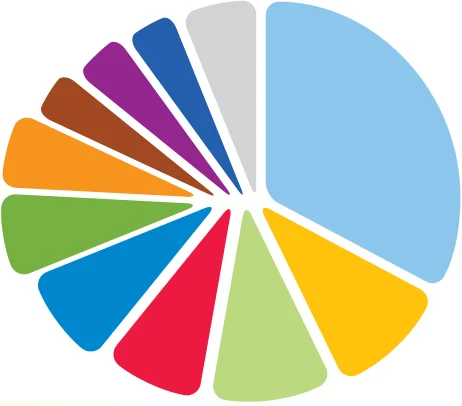
Figure 6.14 Prepared Consumer Food Exports by Category 2022
n Meat preparation 33% n Other food preparations 10% n Chocolate-based products 10% n Pizza/Quiche 8% n Waters & juices & soft drinks 8% n Extracts, sauces, soups 7% n Breads 6% n Dairy preparations 4% n Cereal based products 4% n Sugar-based products 4% n Other 6%
Source: CSO
Pages 206–207 · View in original PDF