6.2 Agri-food sector trade
Agri-food sector trade is broken down into 22 categories identified and agreed upon by the Department of Agriculture, Food and the Marine and the Central Statistics Office. Products and Raw Goods are categorised using combined nomenclature (CN) codes, a European harmonised system used to classify goods for customs and trade reasons. These categories include non-edible Agri-food items such as forestry and animal hides and skins (not included as part of Bord Bia trade statistics), along with traditional food and beverage products.
Ireland’s agri-food exports reached a record €19 billion in 2022, an increase of €3.4 billion or 22% on 2021. Agri-food imports were €12.6 billion, an increase of €2.6 billion or 26%, accounting for 9% of Ireland’s total merchandising imports. The resulting trade surplus in agrifood trade was €6.4 billion in 2022.
20
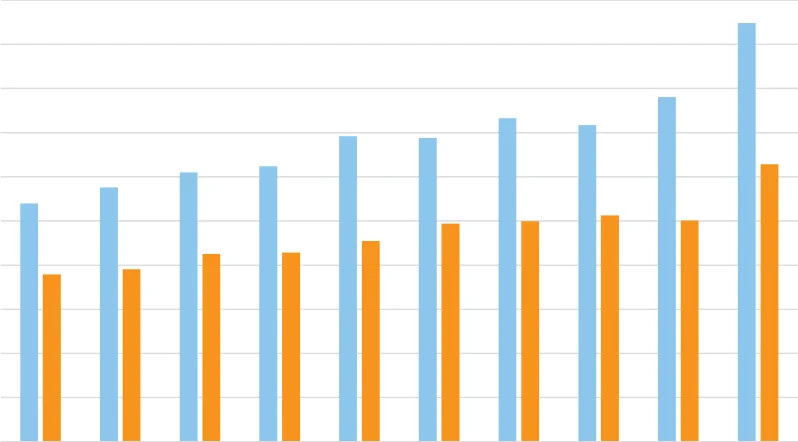
Figure 6.2 Agri-food Trade, 2013 – 2022
18
16
14
Billions €
12
10
8
6
4
2
0
2013 2014 2015 2016 2017 2018 2019 2020 2021 2022
Agri-food sector exports Agri-food sector imports
Source: CSO
In value terms the top five agri-food exports were dairy produce, beef, beverages, pigmeat and forestry & wood products, each product retaining its ranking on the previous year.
Dairy exports increased by €1.7 billion to €6.9 billion, up 33%. M
Beef exports increased by €620 million to €3.1 billion, up 25%. M
Beverage exports increased by €297 million to €2.1 billion, up 17%. M
Pigmeat exports increased by €20 million to €954 million, up 2%. M
Forestry & Wood Products exports increased by €66 million to €749 million, up 10%. M
These top five agri-food categories by value accounted for 72% of total agri-food sector exports in 2022, with a value of €13.7 billion. The chart below demonstrates the contribution of each product category to the overall agri-food exports total.
Dairy Produce
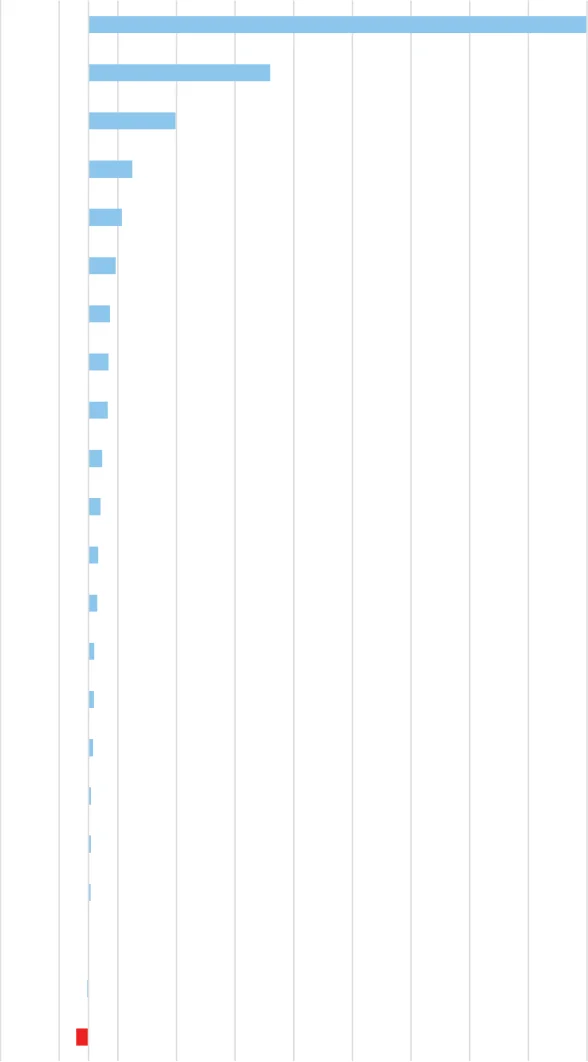
Figure 6.3 Change in Value of Agri-food Sector Exports, 2022 Vs 2021
Beef
Beverages
Animal Feed
Cereal & cereal preparation
Forestry & Wood products
Poultry
Sheepmeat
Live Animals
Coffee, Tea, Cocoa & Spices
Oils, Fats & Oleaginous Fruits
Fish
Misc Edible Products & Preparations
Pigmeat
Crude Animal & Vegetable Material
Fruit & Vegetables Based Products
Egg
Animal Skins & Furs
Sugar, Sugar Preparation & Honey
Wool, Flax & Cotton
Other Meat & Meat Produce
Fruit & Vegetables
-300 -100 100 300 500 700 900 1,1001,3001,5001,700
Millions €
Source: CSO
The value of agri-food exports increased across 19 of the 22 agri-food product categories. Taken in the context of a 1% increase in export volume, this represents strong performance in growing export value. Overall, Ireland’s volume of agri-food exports remained relatively steady at 7.6 million tonnes, though there was variation by category. The volume of Dairy Produce exports accounted for 1.6 million tonnes (-3%), Forestry & Wood Products for 1.5 million tonnes (+4%), Animal Feed for 1.1 million tonnes (-1%), and Beverages for 1 million tonnes (+12%).
Table 6.1 Value and Volume of Agri-food Exports by Category, 2021 – 2022
| Jan-Dec 2021 Jan-Dec 2022 | ||||||
|---|---|---|---|---|---|---|
| Exports | Exports | 2022 v 2021 | 2022 v 2021 | |||
| Category | €000 | Tonnes | €000 | Tonnes | % Value Change | % Volume Change |
| Dairy Produce | 5,194,634 | 1,645,082 | 6,891,650 | 1,588,752 | 33% | -3% |
| Beef | 2,433,114 | 455,581 | 3,052,857 | 491,576 | 25% | 8% |
| Beverages | 1,762,278 | 872,833 | 2,059,426 | 975,479 | 17% | 12% |
| Pigmeat | 936,393 | 290,947 | 956,208 | 285,699 | 2% | -2% |
| Forestry & Wood products | 690,645 | 1,490,013 | 783,715 | 1,545,544 | 13% | 4% |
| Animal Feed | 547,834 | 1,094,767 | 697,513 | 1,079,378 | 27% | -1% |
| Fish | 609,233 | 238,278 | 642,454 | 203,329 | 5% | -15% |
| Cereal & cereal preparation | 506,380 | 271,560 | 620,258 | 283,727 | 22% | 4% |
| Live Animals | 545,364 | 93,020 | 611,402 | 100,712 | 12% | 8% |
| Cofef e, Tea, Cocoa & Spices | 440,370 | 76,766 | 487,548 | 76,894 | 11% | 0% |
| Sheepmeat | 386,495 | 58,264 | 454,942 | 66,477 | 18% | 14% |
| Miscellaneous Edible Products & Preparations | 393,881 | 135,441 | 424,264 | 115,828 | 8% | -14% |
| Poultry | 240,555 | 95,516 | 314,056 | 100,688 | 31% | 5% |
| Fruit & Vegetables Based Products | 181,901 | 110,217 | 198,152 | 110,629 | 9% | 0% |
| Fruit & Vegetables | 220,669 | 96,520 | 179,309 | 96,396 | -19% | 0% |
| Oils, Fats & Oleaginous Fruits | 114,716 | 115,311 | 155,962 | 119,741 | 36% | 4% |
| Crude Animal & Vegetable Material | 136,517 | 210,336 | 154,919 | 201,528 | 13% | -4% |
| Sugar, Sugar Preparation & Honey | 123,153 | 33,799 | 130,464 | 29,475 | 6% | -13% |
| Animal Skins & Furs | 74,013 | 73,150 | 82,506 | 84,557 | 11% | 16% |
| Egg | 37,435 | 10,421 | 46,121 | 10,637 | 23% | 2% |
| Other Meat & Meat Produce | 30,424 | 5,568 | 25,973 | 4,388 | -15% | -21% |
| Wool, Flax & Cotot n | 7,357 | 4,261 | 6,638 | 4,641 | -10% | 9% |
| Grand Total | 15,613,360 | 7,477,650 | 18,976,338 | 7,576,074 | 22% | 1% |
Source: CSO
| The top ten agri-food categories by value (Dairy Produce, Beef, Beverages, Pigmeat, Forestry & Wood products, Animal Feed, Fish, Cereal & cereal preparation, Live Animals and Cofef e, Tea, Cocoa & Spices) accounted for 89% of total agri-food sector exports in 2022, totalling €16.8 billion. The remaining 12 categories accounted for 11% of exports at a value of €2.2 billion. Figure 6.4 Agri-food Exports by Category, 2022 n Dairy produce 36% n Beef 16% n Beverages 11% n Pigmeat 5% n Forestry & wood products 4% n Animal feed 4% n Fish 3% n Cereal & cereal prepararion 3% n Live animals 3% n Cofef e, tea, cocoa & spices 3% n Sheepmeat 3% n Other 9% Source: CSO 187 | |||
|---|---|---|---|
| Chapter SIX Annual Review and | |||
| for Agriculture, Food and the Marine 2023 Outlook | |||
| 87 |
Case Study
Beverages
Beverages exports reached a record high in 2022, exceeding €2 billion for the first time, almost double the value exported a decade ago. This saw growth from €1.1 billion in 2013 to €2.1 billion (+88%) last year. Ireland currently has a trade surplus of €882 million in trade of beverages, with imports of €1.2 billion in 2022. Beverages were exported to over 100 countries globally last year, making up 11% of Ireland’s total agri-food exports, the third largest product category. Beverage exports were challenged in 2020 by the closure of the hospitality sector as a result of Covid-19, but they have since bounced back with a €344 million increase on the previous peak in 2019.
Figure 6.5 Worldwide Beverages Exports 2013- 2022
2,500
2,000
1,500
Millions €
1,000
500
0
2013 2014 2015 2016 2017 2018 2019
€ Tonnes
The top ten destinations by value for Irish beverage exports, were the United States, the United Kingdom, Canada, France, Germany, South Africa, Latvia, the Netherlands, Poland and Italy, which accounted for 80% of beverage exports in 2022. Ireland’s largest products within this category are Irish whisky and Irish cream liqueur, valued at €1 billion and €405 million respectively.
The United States was the largest destination for Irish beverage exports in 2022, valued at €829 million, an increase of 26% on 2021. The UK was the second largest destination with €372 million, made up of €243 million to Great Britain and €129 million to Northern Ireland.
Ireland imported €1.2 billion worth of beverages in 2022, an increase of 17% on the previous year. The top three countries from which Ireland imported the most beverages were the United Kingdom (€522 million), France (€143 million) and the Netherlands (€85 million). The three most common imports were flavoured water, beer and wine.
Source: CSO
Pages 192–196 · View in original PDF