3.9 Intermediate Consumption
3.9 Intermediate Consumption
The total spend on fertilisers in 2022 was €1.2 billion, which was double the spend in
Ireland imports close to
Rolled barley cost €420/tonne
six million
tonnes of animal feed each year.
in July 2022 compared
to €310/tonne in January 2022, up 35%.
2021 of €606 million.
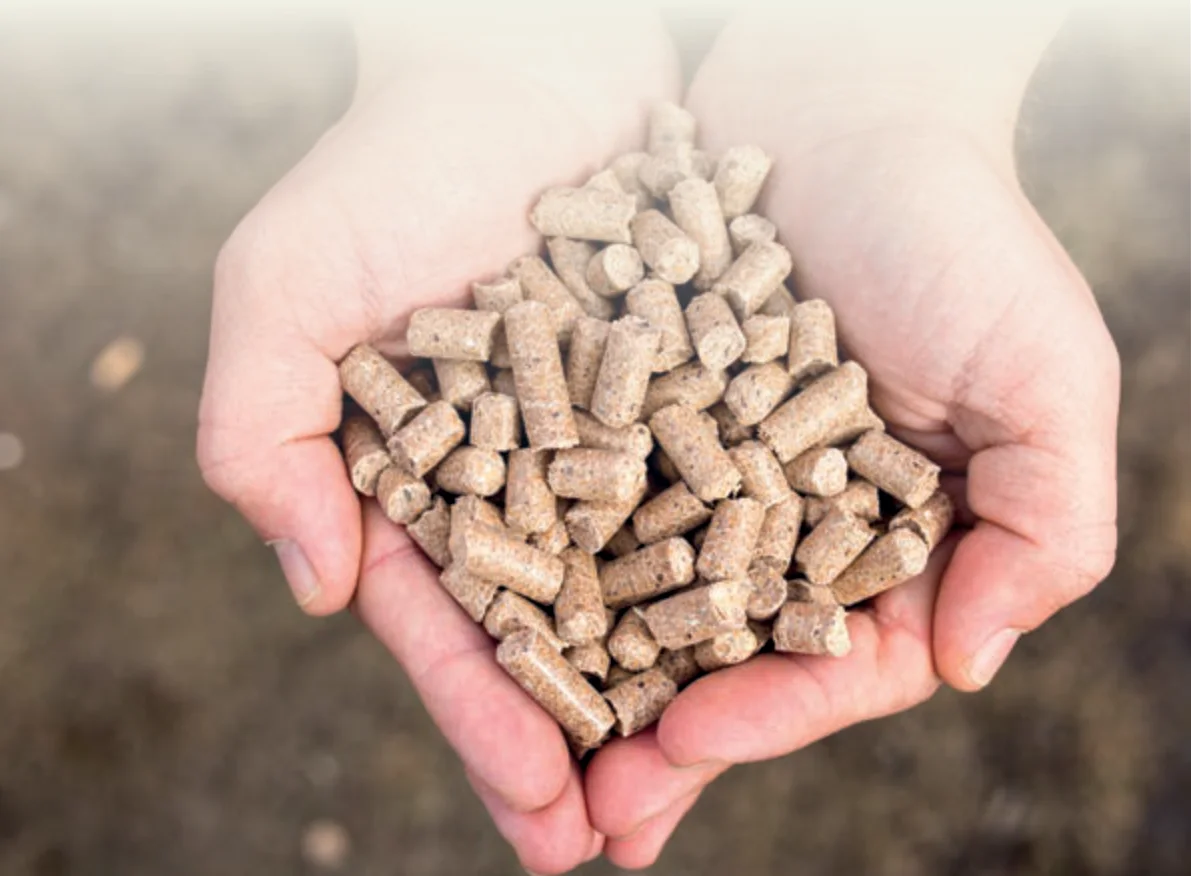
Figure from page 149
General Situation Ireland 2022 Intermediate consumption expenditure in agriculture rose significantly in 2022 due to large increases in cost of fertilisers, feed and energy & lubricants. These three categories of spend accounted for 43% of total intermediate consumption in 2020 but given the significant increases in costs, they accounted for 53% of total intermediate consumption in 2022. The cost of fertilisers used on Irish farms doubled from €605 million in 2021 to €1,208 million in 2022 and this was despite a reduction in the use of fertiliser by 16.5%. As discussed in chapter 2, while the cost of feed, fertiliser and energy has come down slightly in 2023, they are still considerably above the costs in early 2021.
Intermediate consumption is the value of all goods and services used as inputs in the production process. It excludes the cost of acquiring new or existing fixed assets, e.g. tractors, agricultural machinery etc. They are recorded as gross fixed capital formation (GFCF). Intermediate consumption includes expenditure on contract work and forage plants, even if consumed within the same agricultural holding. Detailed data on intermediate consumption is included in the CSO release Output, Input and Income in Agriculture.
Table 3.17 Expenditure on Intermediate Consumption in Agriculture, 2020 - 2022
| Category of Spend 2020 2021 2022 2022 Vs 2021 € Million € Million € Million € Million Percentage | |||||
|---|---|---|---|---|---|
| € Million | Percentage | ||||
| Feeding stuffs | €1,525.2 | €1,798.4 | €2,333.3 | €534.9 | 29.7% |
| Fertilisers | €532.3 | €605.5 | €1,208.0 | €602.5 | 99.5% |
| Energy and lubricants | €377.0 | €461.2 | €634.1 | €172.9 | 37.5% |
| Forage plants | €1,134.4 | €1,108.9 | €1,301.1 | €192.2 | 17.3% |
| Contract work | €430.8 | €464.4 | €573.5 | €109.1 | 23.5% |
| Other expenses | €1,625.7 | €1,704.8 | €1,868.7 | €163.9 | 9.6% |
| Total Intermediate Consumption | €5,625.4 | €6,143.2 | €7,918.7 | €1,775.4 | 28.9% |
Source: CSO
Animal Feed The industrial compound feed production in Ireland for 2022 was 5.7 million tonnes, which is 3.6% higher than in 2021. There was an 8.6% increase in feed imports compared to 2021 levels.
The ongoing conflict in Ukraine continues to impact on animal feed prices. There have been significant knock-on inflationary effects on farm inputs, which has resulted in higher food prices for Irish consumers. In 2022 the cost of feeding stuffs used on farms increased from €1.8 billion in 2021 to €2.3 billion in 2022 an increase of €534 million or 30%.
Table 3.18 Compound Feedingstuffs Production 2017-2022 (Tonnes)
| Year 2017 2018 2019 2020 2021 2022 % of Total | |||||||
|---|---|---|---|---|---|---|---|
| Cattle | 2,919,301 | 3,807,225 | 3,115,864 | 3,120,186 | 3,350,269 | 3,514,972 | 62% |
| Pigs | 692,677 | 712,581 | 705,701 | 768,675 | 781,889 | 723,897 | 13% |
| Poultry | 640,562 | 632,965 | 630,838 | 651,753 | 669,046 | 696,856 | 12% |
| Sheep | 202,719 | 247,882 | 187,160 | 202,093 | 236,950 | 222,858 | 4% |
| Other | 444,103 | 484,775 | 459,831 | 471,218 | 483,557 | 509,377 | 9% |
| Total | 4,899,362 | 5,885,428 | 5,099,394 | 5,213,925 | 5,521,711 | 5,667,960 |
Source: DAFM
Ireland imports close to six million tonnes of animal feed each year with around one million tonnes originating in the United Kingdom. Just less than one million tonnes come from both United States and Argentina. Other major sources of animal feed are Canada (630,000 tonnes), Brazil (508,000 tonnes) and France (355,000 tonnes), with around 170,000 tonnes coming from each of Ukraine, the Netherlands and Russia.
Ireland also exports about one million tonnes of animal feed, with over three quarters of it going to the United Kingdom, but it also goes to more than 30 countries worldwide. Around 40,000 tonnes of animal feed are exported to both Vietnam and the Netherlands, with 24,000 tonnes to Germany and 17,000 tonnes to the Philippines, our top five export destinations.
Animal Feed Prices Feed prices have risen consistently since the beginning of 2020 until the last quarter of 2022 when prices plateaued. According to CSO data on feed stuff prices, in early 2020 rolled barley was around €215/tonne, rising slowly to around €230/tonne at end of 2020, an increase of 9%. However, prices started rising more rapidly in 2021 and by January 2022, rolled barley had increased in price by 32% to €309/tonne. During early 2022 prices rose quickly and stood at €420/tonne in July 2022, up 35% on the January price. However, the second half of 2022 saw better news for those purchasing rolled barley, with prices falling back to €401/tonne by end of 2022. They have continued that fall for the first six months of 2023, reaching €336/ tonne in June 2023. Despite the fall in prices, rolled barley is 44% more expensive in June 2023 compared to January 2021.
€450
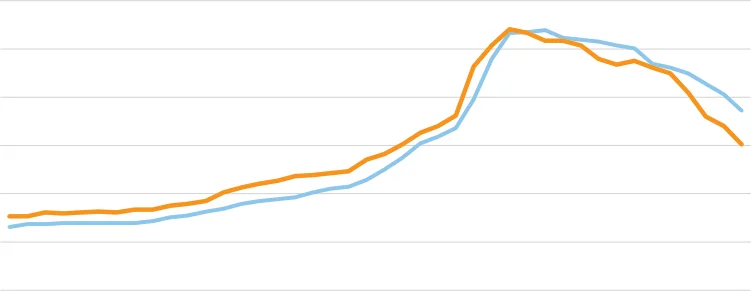
Figure 3.30 Price Per Tonne of Rolled Barley and Wheat 2020 – June 2023. (Non-Zero Axis)
€400
€350
€300
€250
€200
€150
2020 January
2020 July
2021 January
2021 July
2020 October
2022 January
2021 October
2023 January
2022 October
2020 April
2021 April
2023 April
Rolled barley Wheat
Source: CSO
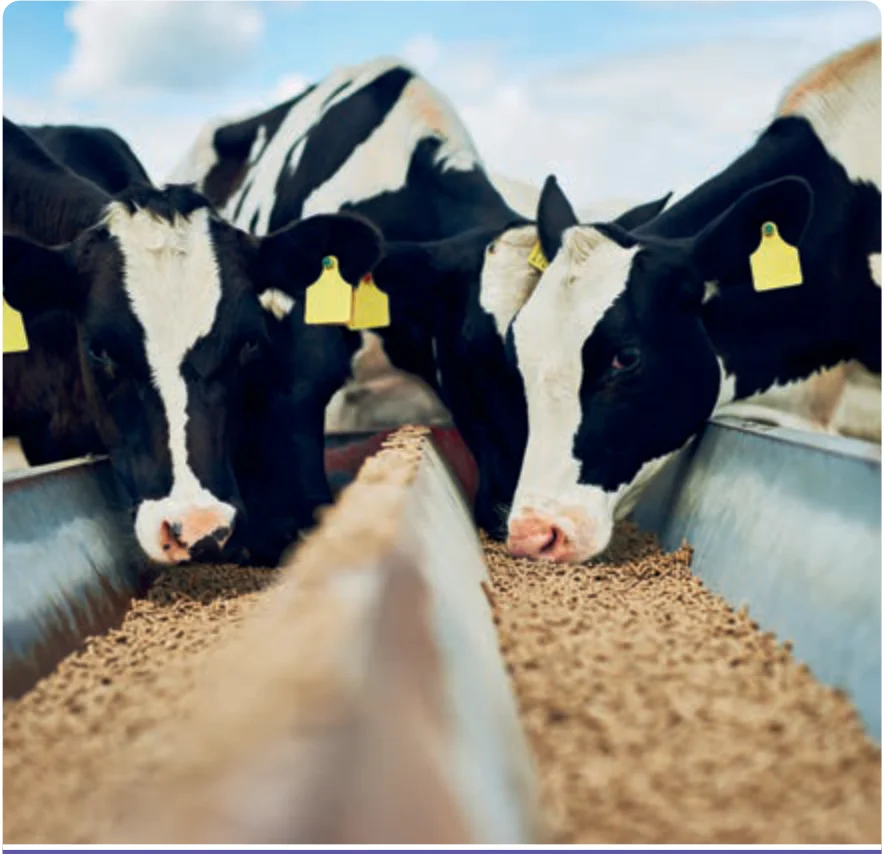
Figure from page 152
Fertiliser There has been an upward trend in fertiliser prices since the start of 2021. While there are a number of factors contributing to these price increases, the major driving factors are increased global demand, rising production costs (particularly the cost of natural gas), and issues with supply for certain fertiliser products.
The illegal invasion of Ukraine by Russia in February 2022 caused a significant shock to the European fertiliser market which had an additional impact on fertiliser prices. However, the Irish fertiliser industry has taken great strides in securing alternative fertiliser supplies. As such, the availability of fertiliser is not a significant issue in 2023. The total spend on fertilisers in 2022 was €1.2 billion, which was double the spend in 2021 of €606 million.
Fertiliser Prices While feed prices rose slightly in 2020, fertiliser prices actually dropped slightly, by 6% to 12%, during the course of 2020. However, from Spring 2021 fertiliser prices rose quickly with Calcium Ammonium Nitrate (27.5% N) increasing by 178% over the course of 2021. The price rises continued in early 2022 with 27.5%N reaching a maximum price of €970/tonne in April 2022, more than four times the price in January 2021 of €229/tonne. Since April 2022 prices have mostly been on a downward trend but at a much slower rate of change then when the price was rising. In June 2023, 27.5%N costs €410/tonne, less than half the price one year earlier but 80% more expensive than in January 2021. Details of the volume of fertiliser and lime used in 2022 can be found in chapter eight.
€1,400
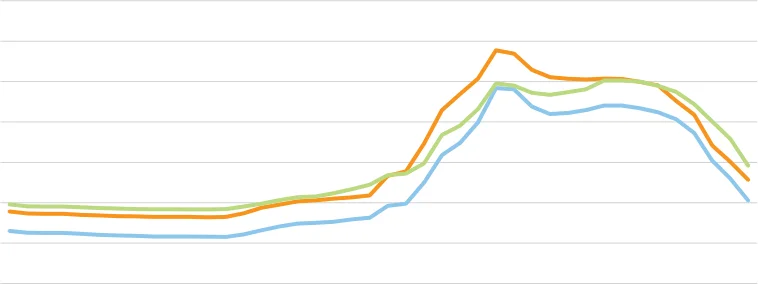
Figure 3.31 Selected Fertiliser Prices 2020 – June 2023.
€1,200
€1,000
Euro Per Tonne
€800
€600
€400
€200
€0
2022 May 2022 July 2022 January 2020 January 2020 May 2020 July 2021 January 2022 September 2022 November 2021 November 2020 September 2020 November 2021 March 2022 March 2020 March
Calcium Ammonium Nitrate (27.5% N) Urea (46% N) Compound 10-10-20
Source: CSO
Agricultural Input Price Indices There has been an upward trend in the CSO’s agriculture input price index since the start of 2021 and the trend continued in the first half of 2022 before the upward trend reversed, but at a much slower rate. While there are a number of factors contributing to these price increases, the major driving factors are significant increase in price of natural gas, the invasion of Ukraine by Russia and increased global demand. In 2022, Ireland imported a little over 15% of its chemical fertiliser from Russia, mostly mineral or chemical fertilisers, containing two or three of the fertilising elements nitrogen, phosphorus and potassium, down from over 20% in 2021. It should be noted that the price of fertiliser varies considerably over the years and according to the CSO index it was almost 19% cheaper in 2020 than it was in 2015. All other agriculture inputs had increased since 2015 by between 2.2% and 9% apart from energy.
Table 3.19 Agricultural Input Price Indices (Base 2015=100), 2020 – 2022
| Agricultural Input Price 2020 2021 2022 2022 Vs 2022 V’s Indices 2021 2020 | |||||
|---|---|---|---|---|---|
| Fertilisers | 81.3 | 101.8 | 226.9 | 122.9% | 179.0% |
| Energy | 98.1 | 112.9 | 160.6 | 42.3% | 63.8% |
| Feeding stuffs | 108.3 | 119.5 | 154.7 | 29.5% | 42.8% |
| Plant protection products | 104.1 | 104.9 | 126.0 | 20.1% | 21.1% |
| Other goods and services | 105.7 | 108.5 | 115.2 | 6.1% | 8.9% |
| Lubricants | 104.9 | 109.2 | 113.7 | 4.2% | 8.4% |
| Maintenance of materials and buildings | 105.1 | 107.3 | 111.5 | 3.9% | 6.1% |
| Veterinary expenses | 109.0 | 110.3 | 113.4 | 2.8% | 4.0% |
| Agricultural input price index | 102.2 | 111.9 | 151.3 | 35.1% | 48.0% |
Source: CSO
While the average increase in the agriculture input price index is 35.1% during 2022 a number of inputs have increased by considerably less such as veterinary expense which have increased by less than 3%.
When analysing the price indices, it is important to consider the change in the index not just over one year but over a longer period. For example, when comparing the 2022 input index with two years earlier in 2020 the index has increased by 48% driven by the massive increase in fertilisers of 179%, energy up 64% and feeding stuffs up 43%. While agriculture input prices had remained relatively stable for many years, similar to consumer prices, with single digit percentage changes each year this has changed since mid to late 2021 when prices began to rise at a much faster pace. Further information on the significant changes in the price index can be found in chapter two, section 2.3.
Sustainability National Fertiliser Database
The National Fertiliser Database has been established to provide accurate tracking of fertiliser. This data will be used to accurately track any reduction in fertiliser over time.
Crude Protein Survey 2022
There was an excellent response to the crude protein survey that was completed in 2022; the response represented 99.7% of overall national feed production. This high response rate gives an accurate picture of current protein levels in livestock rations.
Overall, average crude protein content of dairy, beef, pig and poultry feed for 2021 was 15.9%, 14.9%, 16% and 18.2% respectively. Overall protein levels have been following a positive environmental downward trend since 2015. The biggest reduction has been in pig feed with an overall reduction of 1.3% over this period. While a reduction in the percentage of crude protein was recorded for all feed categories since 2015, except poultry feed, there has been an increase in crude protein over the time period examined due to an increase in volume of animal feed produced.
Reducing crude protein content in livestock rations can reduce both N excreted and the proportion of N in urine and is an important mitigation measure in reducing ammonia and N2O emissions. It is one of the measures outlined in the government Climate Action Plan and also DAFM’s Ag-Climatise roadmap.
Accurate data and its application are of critical importance in the development of emissions reduction strategies. This survey will provide the data necessary to underpin strategy development and policy in this area. The survey will be repeated in 2024.
Highlights
The quantity of protected urea sold in 2022 was 69,593 tonnes, an increase of more M than 50% on 2021.
Ground limestone usage, which was up 50% in 2021 compared to 2020, increased by M a further 4% in 2022 to 1,386,915 tonnes.
Ireland Outlook
The Teagasc Situation and Outlook issued in July 2023 indicated for the rest of 2023, M global cereal market developments, as reflected in the ‘on account’ harvest prices reported at harvest 2023, indicate a significant decrease in Irish cereal prices relative to 2022. A 20% decrease in farm-gate cereal prices for the 2023 harvest is forecast. Averaging across the full year however, it is likely that Irish farm gate feed prices in 2023 will be approximately 10% higher than in 2022.
Fertiliser use on tillage farms is likely to remain closer to normal, given that reductions M in use can easily impact on yields. However, accurate data on this will not be available until late 2023. Combining a reduction in use, with a 10% fall in prices over the first half of 2023, the expenditure on fertiliser in Ireland will decline in 2023.
Overall, Irish agriculture will see a decline in expenditure on fuel in 2023 compared to M 2022, but expenditure on electricity in 2023 is likely to be higher than in 2022.
EU Outlook
Uncertainties resulting from the Russian invasion of Ukraine, inflation and disease M issues will result in market conditions for animal feed remaining difficult. Increased focus on sustainably-sourced feed ingredients will inevitably result in price increases.
The outlook for fertiliser prices will normalise as the global market adjusts to the M issues of 2022. The price is already decreasing. The primary reason for the reduction in fertiliser prices is due to increased availability of natural gas in Europe amid a moderate winter in 2022 and abundant LNG imports, which enabled manufacturers to restart production with significantly cheaper inputs.
| 4 CHAPTER | Forestry | |||
|---|---|---|---|---|
| In 2022, The national forest estate Felling licences issued for is a sink for approximately €70 million clearfell in the private sector 323 million increased significantly from was spent by DAFM on forest 8,278 hectares in 2021 to activities including afof restation, tonnes maintenance grants, annual 14,006 hectares of carbon. premium payments, and grants in 2022. for forest road infrastructure. |

Figure from page 157
Pages 149–157 · View in original PDF