3.1 Overview
3.1 Overview
The CSO release Output, Input and Income in Agriculture, Final Estimate 2022 provides the numerical detail on the various elements which have an impact on farm income in 2022. The Output, Input and Income (OII) in Agriculture has been produced since 1990 and provides valuable data on farm outputs, inputs and the overall level of farm income through the years.
Chapter two looked at the estimated value of goods output at producer prices for livestock, livestock products and crops. It also examined the cost of intermediate consumption or inputs, including the value of subsidies and estimated the operating surplus or aggregate farm income. Here we will look at the change in volume and price which impacted how the value of gross output at producer prices and intermediate consumption changed in 2022, along with the change in gross value added at basic prices. This is the difference between the output at basic prices (the producer price plus any subsidies directly linked to a product minus any taxes on products) and intermediate consumption. It is a measure of gross income before depreciation, subsidies and taxes on production and compensation of employees. According to the OII, agriculture’s gross value added at basic prices in 2022 was €4.97 billion, a 25.5% increase on 2021 figure, which in itself was a 21% increase on the 2020 figure. This increase was almost entirely due to increased prices of 23.8%, with volume increasing by just 1.8%.
Gross output at producer prices was €12.29 billion, up 27.9% in value. Again, the price increase of 27.5% was the main driver of this increase, with volume almost static at +0.1%. Intermediate consumption at €7.9 billion was up 28.9% on 2021, with volume the same as the previous year, but price up by 28.2%.
Cattle and calves are the largest livestock category, responsible for 24.6% of gross output, down from 27% in 2021. The estimated value of cattle and calves increased by 17.3% in 2022 to €3.03 billion. This increase was generated by a price increase of 17.3%, while volume was down slightly by 0.9%. Milk is the largest category of output by value, representing 41% of total agricultural output. The gross output value of milk increased significantly by 48.0% in value to €5.03 billion, and similar to cattle and calves output, the volume saw little change, up less than 1%.
Cereals saw the largest increases in gross output at producer prices, with an increase of 60% in value. This was following an increase of 50% in value in 2021. While price increase contributed most of the increased value in 2022 at 51.6%, there was also an increase in volume of 4.9%. The pig sector, which had a difficult year in 2021, saw a recovery with gross output up 11.7% in 2022 following a 14.3% increase in price, but a drop of 2.4% in volume. Poultry gross output was up by 8.9% to €204 million, mainly due to stronger prices. Potatoes saw prices increase by 6.5% but, with volume down 14.8%, the gross output was down 6.6% to €163 million.
Intermediate consumption or farm inputs in 2022 cost €7.92 billion, up 28.9% on 2021. Fertilisers saw the biggest increase in intermediate consumption costs, up a massive 99.5% to €1.2 billion, arising from a price increase of 136.7% and a volume decrease of 16.5%. In 2021 fertiliser accounted for 10% of the input costs overall but in 2022 it accounted for 15% of total costs, despite the fall in volume used. Animal feed was the largest input cost with a spend of €2.33 billion in 2022, up 29.7% on the previous year, with almost all of the increased expenditure due to increase in price. Energy and lubricants, which account for 8% of farm inputs, saw spend increase by 37.5% to €634 million, again driven by a high increase in price of 42.3%, while volume used was down 3.4%. These three items, namely fertilisers, animal feed and energy & lubricants, account for over half of spend on inputs in 2022 at 53%. Their combined cost increased from €2.86 billion in 2021 to €4.17 billion in 2022, an increase of 45.7%.
Table 3.1 Gross Output at Producer prices, Intermediate Consumption and Gross Value Added 2022
| Value % Change 2022 over 2021 Share of GO/ Inputs €m Value Volume Price % | |||||
|---|---|---|---|---|---|
| Gross Output at Producer Prices | 12,285.3 | 27.9 | 27.5 | 100% | |
| 0.1 | |||||
| Cattle and Calves | 3,026.8 | 17.3 | -0.9 | 17.9 | 25% |
| Pigs | 620.2 | 11.7 | -2.4 | 14.3 | 5% |
| Sheep and Lambs | 377.3 | 2.7 | 0.6 | 2.3 | 3% |
| Poultry | 204.2 | 8.9 | -1.0 | 13.3 | 2% |
| Milk | 5,026.2 | 48.0 | 0.8 | 46.5 | 41% |
| Cereals | 694.7 | 60.0 | 4.9 | 51.6 | 6% |
| Potatoes | 163.0 | -6.6 | -14.8 | 6.5 | 1% |
| Fresh Vegetables and Fruit | 324.3 | n/a | n/a | n/a | 3% |
| Forage Plants | 1,307.8 | 17.5 | -0.1 | 17.2 | 11% |
| Other | 540.8 | n/a | n/a | n/a | 4% |
| Intermediate Consumption (Inputs) | 7,918.7 | 28.9 | 0.0 | 28.2 | 100% |
| Animal Feed | 2,333.3 | 29.7 | 0.8 | 29.0 | 29% |
| Fertilisers | 1,208.0 | 99.5 | -16.5 | 136.7 | 15% |
| Energy & Lubricants | 634.1 | 37.5 | -3.4 | 42.3 | 8% |
| Maintenance & Repairs | 603.1 | 10.3 | 6.1 | 3.9 | 8% |
| Forage Plants | 1,301.1 | 17.3 | -0.2 | 17.1 | 16% |
| Contract Work | 573.5 | 23.5 | 12.9 | 8.8 | 7% |
| Others | 1,265.6 | n/a | n/a | n/a | 16% |
| Gross Value Added at Basic Prices | 4,974.8 | 25.5 | 1.8 | 23.8 | n/a |
Source: CSO
Stock Changes on Farms Each year the CSO calculate the estimated value and volume of stock changes on farms compared to the previous year. Cattle, sheep and crop values on farms, which increased in value in 2021, saw decreases in 2022, along with volume decreases for cattle and sheep. Pig values at farm level decreased slightly in 2021 and again in 2022, while the volume of pigs also decreased. Poultry values and volumes have remained constant over the past two years.
Table 3.2 Estimated Value (€m) and Volume1 (000s) of Stock Changes on Farms 2021/2022
| 2021 Value €m Number ‘000 | 2022 | |||
|---|---|---|---|---|
| Value €m | Number ‘000 | Value €m | Number ‘000 | |
| Cattle | 96.09 | 120 | -21.99 | -97 |
| Sheep | 18.94 | 149 | -1.33 | -8 |
| Pigs | -0.64 | 35 | -7.81 | -143 |
| Poultry | 0.00 | 0 | 0.00 | 0 |
| Crops | 29.84 | 117 | -1.25 | 9 |
| Total | n/a | 421 | n/a | -240 |
1 Volume of livestock is in heads (‘000s), volume of crops is in tonnes (‘000s).
Source: CSO
Livestock Numbers Ireland The CSO issue the results of their livestock survey twice each year, in June and December. While cattle numbers vary from year to year, they also vary during the year. Most calves tend to be born in the springtime or early summer each year, resulting in higher numbers of cattle in the June census compared to the December census.
The latest results available at time of writing is the CSO December 2022 Livestock Survey and it indicates that the total number of cattle dropped by 97,500 or by 1.5% to 6,551,800 in December 2022 compared to a year earlier. However, it is slightly up on the 2020 numbers, but down compared to other recent years. Almost 30% of the cattle herd are male and 70% female. Of the 4.66 million female cattle, a little over half (2.37 million) are cows, with the remainder mostly calves and females under two years of age. Dairy cows account for 1.51 million cattle with other cows, mainly suckler cows, accounting for some 861,700 cattle. Bulls used for breeding purposes account for less than 1% of all cattle at 46,200.
In December 2022, there were just over four million sheep, similar to the previous year. The sheep flock comprises 2.7 million ewes, 89,000 breeding rams and 1.3 million other sheep. Following a difficult year for pig farmers, pig numbers have fallen by 8.4% or 143,000 pigs to 1.57 million pigs, down from 1.71 million in December 2021. Breeding pig numbers have fallen by over 12% or 18,400 to 127,500, while there are 1.44 million other pigs, mainly growing and fattening pigs.
Looking at the size of the animal herds over the past 22 years, since 2000, the numbers of cattle have increased, while the numbers of sheep and pigs have decreased. The cattle herd has increased by 3.5%, or over 220,000 animals, but the increase has not been distributed evenly across the years. The cattle herd was at its lowest since the turn of the century in 2010 and 2011, when it fell close to 5.9 million cattle and at its highest in 2017 when it reached 6.67 million. Over that time dairy cow numbers have increased by 357,500, while other cows or suckler cows have decreased by 293,500, resulting in an additional 64,000 cows in 2022 compared to 2000.
The sheep flock has fluctuated in size considerably over the past 22 years. There were just over five million sheep in 2000 and this has fallen by one million to just over four million in 2022, a drop of 20%. Meanwhile, the number of pigs were at their lowest over the past 22 years in 2013 when they had fallen to 1.47 million, down from 1.80 million in 2002, before rising again to 1.57 million in 2022, down around 10% on numbers in the first few years of this century.
Figure 3.1 Cattle, Sheep and Pig Livestock numbers, 2000 – 2022
7,000,000
6,000,000
5,000,000
4,000,000
3,000,000
2,000,000
1,000,000
0
2000 2005 2010 2015 2022
Total cattle Dairy cows Other cows Total sheep Total pigs
Source: CSO Livestock Survey
Livestock Numbers in the EU According to Eurostat data, there are 74.8 million cattle in the 27 EU countries in 2022. This compares to 79.7 million in 2016, which was the highest number of cattle in the EU over the past decade. This reduction in cattle numbers by 6%, or close to five million head of cattle over the past six years, has been a gradual process with numbers falling each year. The largest fall in cattle numbers happened in France, where numbers fell from 19.4 million to 17 million, and Germany, where numbers fell from 12.5 million to 11 million, a drop of about 12% in both countries. The Netherlands also saw a drop of 12% from 4.3 million cattle to 3.8 million cattle. Ireland, which has the third largest herd in the EU27 countries, saw numbers fall by 1% or by around 62,000 cattle.
Figure 3.2 Comparison of Irish and EU Cattle Numbers in 2016 and 2022 by Country
20
Million Head of Cattle
15
10
5
Belgium
Germany
Italy
France
Ireland
Spain
Poland
Netherlands
Denmark
Sweden
Austria
Czechia
Romania
Other 13
Portugal
2016 2022
Source: Eurostat, Agriculture, Forestry and Fisheries
There were 59.5 million sheep in the EU27 member states in 2022 and like cattle numbers they have reduced in recent years. In 2017 there were 63.6 million sheep the highest in recent years, 4.1 million more (or 6.5%) higher than in 2022. Spain, which has the largest sheep flock in the EU27, saw the largest fall in numbers from 16 million to 14.5 million, a drop of almost 10%, while Greece which has the third largest sheep flock, saw numbers drop by 1.2 million (or 14%) to 7.4 million sheep in 2022. Romania which has the second largest sheep herd in the EU27 saw their sheep numbers increase by 3% over this period, from 10 million in 2017 to 10.2 million in 2022. Ireland’s sheep flock increased by 1% during this period, by 40,000 sheep to 4.02 million, the sixth largest flock in the EU27.
Figure 3.3 Comparison of Irish and EU Sheep Numbers in 2017 and 2022 by Country
16
14
Million Head of Sheep
12
10
8
6
4
2
Germany
Italy
Hungary
France
Ireland
Other 16
Bulgaria
Spain
Romania
Greece
Portugal
Netherlands
2017 2022
Source: Eurostat, Agriculture, Forestry and Fisheries
In 2022 there were 134.4 million pigs in the EU27 countries with the largest number in Spain at 34.1 million, followed by Germany with 21.4 million pigs. The number of pigs were almost 146 million in the EU 27 in 2020, just somewhat higher than in 2017, the two years with the highest number of pigs in the last decade. The largest drop in pig numbers in 2022, compared to 2020, were in countries in the eastern part of the EU where swine fever saw large number of pigs slaughtered to prevent further spread of the disease and also because of low pigmeat prices throughout the EU. Germany and Poland saw numbers drop by 18% in each country, while Denmark saw numbers drop by 14%, Romania by 12% and Hungary by 10%. Ireland, which has the thirteenth largest pig herd in the EU27, saw pig numbers drop by 6.4%, or by 110,000 pigs.
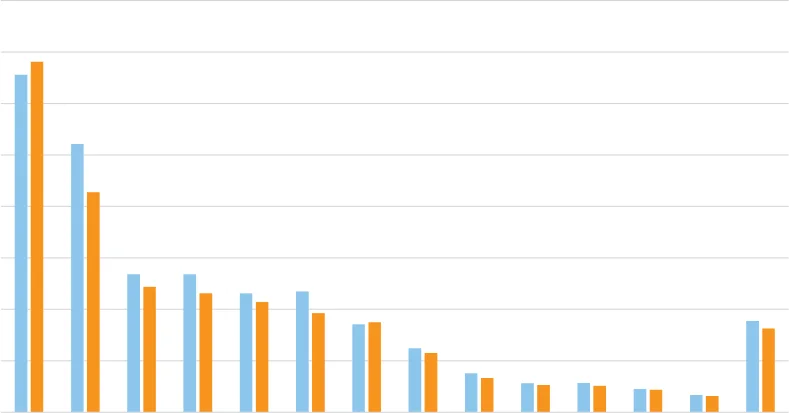
Figure 3.4 Comparison of Irish and EU Pig Numbers in 2020 and 2022 by Country
35
30
Million Head of Pigs
25
20
15
10
5
Germany
Italy
Hungary
France
Denmark
Netherlands
Poland
Spain
Belgium
Romania
Austria
2020 2022
Source: Eurostat, Agriculture, Forestry and Fisheries
Pages 86–92 · View in original PDF