8.13 Teagasc National Farm Survey 2021 Sustainability Report
The Teagasc National Farm Survey 2021 Sustainability Report provides the latest available information on the sustainability performance of farms in Ireland, based on detailed analysis of data collected through the Teagasc National Farm Survey (NFS). Economic, Social, Environmental and Innovation sustainability dimensions are measured for dairy, cattle, sheep and tillage farms in 2021. In chapter two of this publication the economic performance was highlighted using the preliminary data from the 2022 NFS along with some of the social sustainability indicators from the 2021 NFS Sustainability report. Here the focus is on the environmental dimension.
Agriculture can generate positive or negative environmental impacts depending on the specific activities undertaken on the farm. Agriculture is the principal land use in Ireland and the environmental sustainability of agriculture is key to achieving national level objectives relating to the environment. The current set of NFS based environmental indicators focus on greenhouse gas (GHG) emissions, ammonia emissions and nitrogen and phosphorus use.
Greenhouse Gas Emissions As highlighted earlier in this chapter, provisional EPA Inventory data shows that the agriculture sector was directly responsible for 38.4% of national Greenhouse Gases (GHGs) emissions in 2022, mainly methane from livestock, and nitrous oxide due to the use of nitrogen fertiliser and manure management. The EPA data also indicates that greenhouse gas emissions from agriculture in Ireland decreased by 1.2% in 2022 following an increase in 2021 of 3.6%.
The data in the NFS Sustainability Report covers the period up to 2021 only and therefore does not reflect the reduction in GHGs from agriculture in 2022 as reported by the EPA. As methane from livestock contributes significantly to GHGs, dairy farms which tend to be larger in area and to be more heavily stocked than cattle or sheep farms, will produce more GHGs than the other livestock sectors. Tillage farms, which tend to be of a similar size to dairy farms, produce less GHGs due to smaller numbers of livestock. While GHGs have increased on dairy farms each year between 2016 and 2021, this is unlikely to continue to the same extent as during that period many dairy farms expanded following the removal of milk quotas in 2015.
650
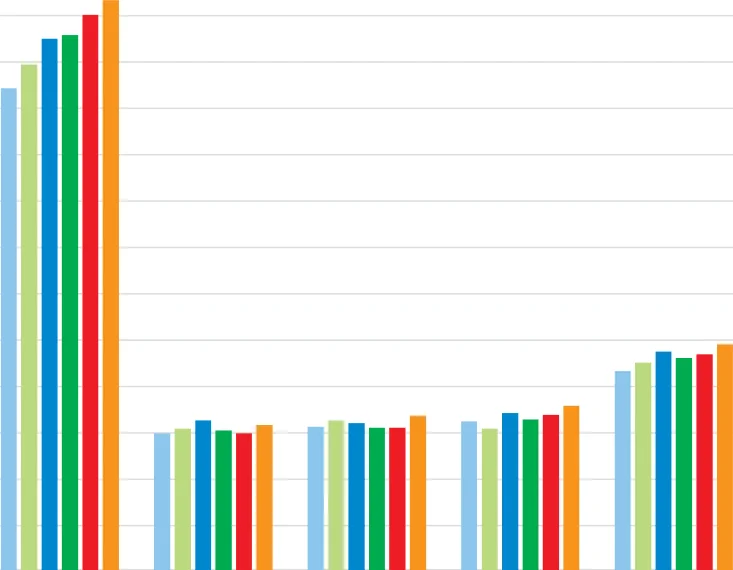
Figure 8.8 Total Farm Average GHG Emissions 2016 - 2021
600
550
500
Tonnes CO2 eqv per farm
450
400
350
300
250
200
150
100
50
0
Dairy Farms Cattle Farms Sheep Farms Tillage Farms All Farms
2016 2017 2018 2019 2020 2021
Source: Teagasc NFS Sustainability Report 2021
The average emissions across all farms have risen slightly over the period 2016 to 2021 but as mentioned earlier, provisional data from the EPA indicate that GHG emissions in agriculture have fallen somewhat in 2022.
The report also looks at GHG emissions emitted based on the value of output. This indicates that average GHG emissions emitted per euro of output have been tending to fall in recent years. It also highlights that based on output, both cattle and sheep farms generate more GHGs than dairy farms and tillage farms.
6
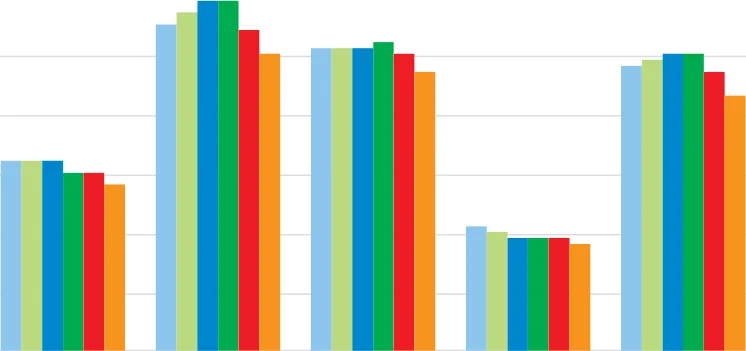
Figure 8.9 Average GHG Emissions Emitted per € output - 3 Year Rolling Average 2016 - 2021
5
KG CO2 eqv per €Output
4
3
2
1
0
Dairy Farms Cattle Farms Sheep Farms Tillage Farms All Farms
2014-2016 2015-2017 2016-2018 2017-2019 2018-2020 2019-2021
Source: Teagasc NFS Sustainability Report 2021
Ammonia Ammonia (NH3) is an air pollutant contributing to eutrophication and acidification of terrestrial and aquatic ecosystems. In Ireland ammonia emissions come almost exclusively from agriculture. In this report, Teagasc have categorised farms by their main activity such as dairy or cattle. However, as can be seen in the table with a breakdown of ammonia emissions by farm, most farms have more than one category of farming taking place. While most of the ammonia emissions on a dairy farm are generated by the dairy enterprise, most dairy farms have cattle, and in some cases sheep or tillage also, and these other enterprises also contribute to the total emissions.
Table 8.2 Average Tonnes of Ammonia Emissions by Farm 2021.
| Tonnes of Ammonia Emissions 2021 | |||||
|---|---|---|---|---|---|
| Dairy | Cattle | Sheep | Tillage | Total | |
| Dairy Farms | 2.13 | 0.76 | 0.006 | 2.8960 | |
| Cattle Farms | - | 0.77 | 0.16 | 0.001 | 0.9310 |
| Sheep Farms | - | 0.42 | 0.36 | 0.0006 | 0.7806 |
| Tillage Farms | - | 0.49 | 0.053 | 0.19 | 0.7330 |
Source: Teagasc NFS Sustainability Report 2021
As can be seen in the table most of the ammonia emissions are generated by dairy followed by cattle enterprises on all farms, while the level of ammonia emissions generated by sheep or tillage enterprises is relatively small.
Nitrogen (N) and Phosphorus (P) The report also looks at nitrogen (N) and phosphorus (P) use indicators. These indicators measure N and P brought onto the farm and exported from the farm. It should be noted that the N and P indicators do not provide estimates of losses to water, as such losses are complex and driven by site-specific biophysical factors and weather conditions. N and P balances are used as an indicator of potential risk of loss of nutrients, all other things being equal. Both N and P are important elements in agriculture production.
The data illustrates that dairy and cattle farms tend to have the lowest nitrogen use efficiency (NUE) over the study period. Tillage system NUE was generally significantly higher than all other systems due to the mainly non-livestock nature of this system.
80
70
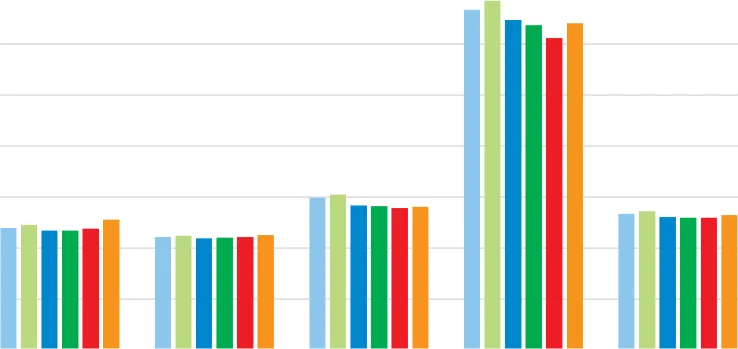
Figure 8.10 Nitrogen Use Efficiency (NUE) (Percentage) - 3 Year Rolling Average 2016 - 2021
60
50
NUE (%)
40
30
20
10
0
Dairy Farms Cattle Farms Sheep Farms Tillage Farms All Farms
2014-2016 2015-2017 2016-2018 2017-2019 2018-2020 2019-2021
Source: Teagasc NFS Sustainability Report 2021
Based on a three-year rolling average basis across all farm systems, Phosphorous use efficiency (PUE) has generally declined between the start and end of the period analysed for dairy and tillage, while it has increased for cattle systems. However, farm gate PUE measures must be interpreted with care, since establishing true PUE requires a soil test.
Both the Nitrogen use efficiency and Phosphorous use efficiency is used to highlight the proportion of N retained in the farm system (N outputs / N inputs). This is a generic measure allowing temporal comparisons at the farm gate level.
Figure from page 275
90
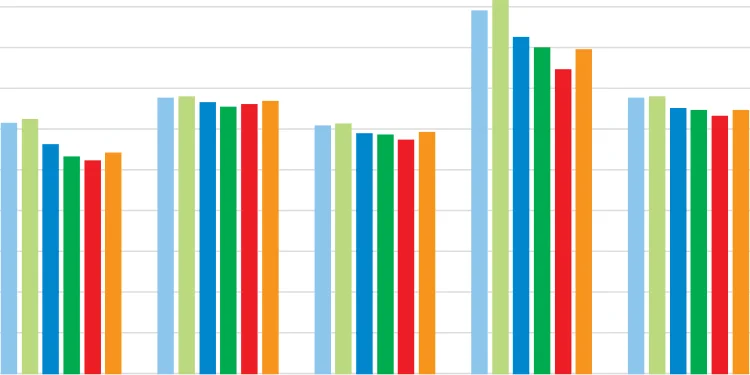
Figure 8.11 Phosphorus Use Efficiency (NUE) (Percentage) - 3 Year Rolling Average 2016 - 2021
80
70
60
PUE (%)
50
40
30
20
10
0
Dairy Farms Cattle Farms
2014-2016 2015-2017 2016-2018 2017-2019 2018-2020 2019-2021
Source: Teagasc NFS Sustainability Report 2021
Innovation Indicators The report also looks at innovation indicators where farmers are adapting management techniques to drive efficiency and profitability, while reducing negative environmental and social effects, thereby assisting progress towards more sustainable agriculture. Among the measures looked at are the following:
Discussion groups M
Liming M
Spring slurry spreading M
Protected urea use M
Reseeding M
Low emission slurry spreading M
Break crop on tillage farms and M
Milk recording on dairy farms. M
As highlighted earlier in this chapter the use of lime has increased in recent years. While this will contribute to GHG emissions, it adjusts the soil pH towards its optimum and will ultimately improve plant nutrient take up.
The use of low emission slurry spreading has also increased in recent years and the Teagasc report indicates that 48% of slurry was applied by this method in 2021, up from just 4% in 2018.
| 9 CHAPTER | Research | |||
|---|---|---|---|---|
| DAFM Research funded Funding for climate A new bilateral 49 projects research in 2022 was Joint Research up 250% in 2022 with a total value of Mechanism €21.4 million. compared to 2020. was established in 2022 with New Zealand. |
Pages 272–277 · View in original PDF