6.8 Agri-Food Imports by Country
6.8 Agri-Food Imports by Country
In 2022, agri-food goods were imported into Ireland from over 180 countries worldwide. Ireland’s top five import countries were the United Kingdom, the Netherlands, Germany, France and the United States, which accounted for 65% or €8.2 billion of Ireland’s total imports for the year.
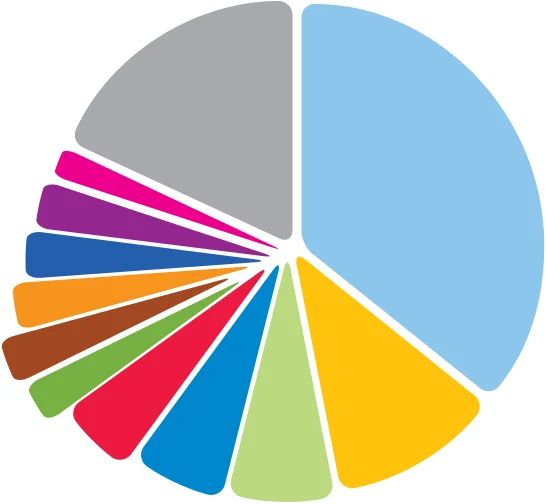
Figure 6.16 Top 10 Agri-Food Imports by Country 2022
n United Kingdom 36%
n The Netherlands 11%
n Germany 7%
n France 6%
n United States 5%
n Belgium 3%
n Argentina 3%
n Spain 3%
n Poland 3%
n Brazil 3%
n Italy 2%
n Other 18%
Source: CSO
The United Kingdom is Ireland’s largest import partner, accounting for 36% of agri-food imports and a total value of €4.6 billion in 2022. This was made up of imports of €2.7 billion from Great Britain and €1.9 billion from Northern Ireland. Imports of €4.6 billion from the UK represents an increase of €709 million (+18%) on 2021.
Dairy Produce was the largest product category imported into Ireland from the UK in 2022, valued at €676 million. This represented an increase of €206 million (+44%) on the previous year. Cereal and cereal preparations was the second largest product category, increasing by €73 million (+14%) to €608 million.
Ireland imported agri-food to the value of €1.4 billion from the Netherlands in 2022, our second largest imports market, an increase of €230 million (+20%) on the previous year. The largest product category from the Netherlands was oils, fats, and oleaginous fruits, which increased by €54 million (+38%) to €198 million last year. This was followed by poultry, of which imports increased by €45 million (+40%) to €157 million.
Germany, as the third largest source of imports, accounted for €902 million or 7% of Ireland’s total agri-food imports. The largest product category imported from Germany was dairy produce, which increased by €73 million (+82%) to €162 million in 2022. The second largest product category imported was fruit and vegetables, which were valued at €129 million last year.
Table 6.8 Value and Volume of Agri-food Imports by Top 20 Locations, 2021 - 2022
| 2021 2022 2021 v 2022 | ||||||
|---|---|---|---|---|---|---|
| Category | €000 | Tonnes | €000 | Tonnes | €000 | Tonnes |
| United Kingdom | 3,859,986 | 3,683,704 | 4,568,583 | 3,989,590 | 18% | 8% |
| Netherlands | 1,148,726 | 861,906 | 1,379,159 | 842,026 | 20% | -2% |
| Germany | 657,737 | 444,242 | 902,244 | 460,646 | 37% | 4% |
| France | 574,000 | 713,979 | 714,050 | 754,091 | 24% | 6% |
| United States | 418,324 | 833,711 | 617,828 | 1,048,242 | 48% | 26% |
| Belgium | 311,217 | 288,611 | 406,430 | 299,300 | 31% | 4% |
| Argentina | 236,599 | 725,181 | 393,700 | 964,913 | 66% | 33% |
| Spain | 303,854 | 239,708 | 361,082 | 234,206 | 19% | -2% |
| Poland | 254,303 | 224,870 | 360,899 | 203,732 | 42% | -9% |
| Brazil | 125,355 | 275,642 | 296,755 | 572,692 | 137% | 108% |
| Italy | 228,221 | 123,977 | 267,631 | 132,139 | 17% | 7% |
| Canada | 184,868 | 624,739 | 240,805 | 647,527 | 30% | 4% |
| China | 160,070 | 59,846 | 220,777 | 64,655 | 38% | 8% |
| Denmark | 137,813 | 130,782 | 134,915 | 112,262 | -2% | -14% |
| Malaysia | 89,981 | 93,265 | 115,919 | 65,729 | 29% | -30% |
| Thailand | 57,474 | 20,807 | 93,318 | 22,628 | 62% | 9% |
| India | 60,309 | 91,183 | 74,783 | 51,504 | 24% | -44% |
| Austria | 55,427 | 20,002 | 72,933 | 34,889 | 32% | 74% |
| Switzerland | 56,323 | 9,278 | 72,513 | 14,742 | 29% | 59% |
| Chile | 58,240 | 23,526 | 72,334 | 25,257 | 24% | 7% |
| Top 20 Total | 8,978,828 | 9,488,959 | 11,366,659 | 10,540,771 | 27% | 11% |
Source: CSO
Figure from page 214

Figure from page 215
Pages 213–215 · View in original PDF