2.3 Agricultural Price Index
The agricultural output price index measures trends in the price of agricultural produce sold by farmers. The agricultural input price index is designed to measure trends in the price of farm inputs purchased for current consumption. When the input and output price indices are examined together, it gives an indication of the movement in the margin for profit. As with any index, a base year is chosen when the prices are set at 100. Subsequent years can be compared relative to the base year.
Agricultural Input Price Indices Figure 2.5 highlights the monthly input price index between January 2014 and March 2023. The main feature up to mid-2021 was that fertiliser index was below 100 since late 2016, indicating that fertiliser was relatively cheap compared to 2015, when the index was set at 100. However, from January 2021 when the index for fertiliser was close to 80, it began to rise and it rose rapidly for a year or so, reaching a high of 251 in April 2022, indicating that the price had tripled over that 15-month period. While it has fallen from its high of 251, the drop has been much slower than the rise. In March 2023, it was at 210, indicating the price of fertiliser has fallen by 16%, but it is still 163% higher than it was in January 2021.
250
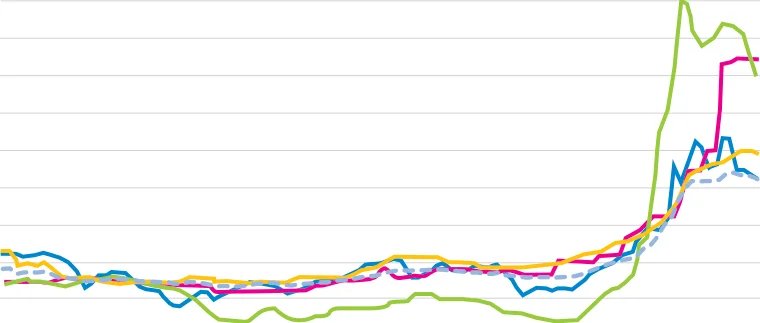
Figure 2.5 Agricultural Input Monthly Price Indices, Jan 2014 – March 2023 (Base 2015=100)
230
210
190
170
150
130
110
90
70
2014 Jan
2015 Jan
2016 Jan
2017 Jan
2018 Jan
2019 Jan
2020 Jan
2021 Jan
2022 Jan
2023 Mar
Energy Electricity Fertilisers Feeding stuffs Agricultural input price index
Source: CSO
Over the seven-year period between January 2014 and December 2020, the fertiliser index had gone between a high of 102 (in Q2 2015) and a low of 79 (in Q4 2016 & Q3 2017), a range of 23 points. In contrast, over an eight month period between September 2021 and April 2022 it rose from 104 points to 251 points, up by 147 points or by more than 140%.
There has been significant increase in the price of other agriculture inputs over the same period but not to the same extent. Electricity index rose from 110 points in January 2021 to a high of almost 220 points in Q4 2022 and Q1 2023, an increase of 100% over that time period.
While input prices have stabilised in the first half of 2023, they are still well above the prices in early 2021 and indications are that they will drop far slower than they rose. Fertiliser in March 2023 was 165% higher than in January 2021, while electricity was 100% more expensive and feeding stuffs were about 51% more expensive.
The input price index covers all inputs for agriculture. Items such as veterinary expenses, plant protection products and maintenance of materials and buildings did not have the same dramatic increases as fertilisers, energy and feed and this is reflected in the dashed line in figure 2.5.
Agricultural Output Price Indices On the other side, the price of agricultural outputs has also increased but not to the same extent. The price of milk paid to farmers saw the largest increase. Before January 2021 it was on an upward trend, having risen from 105 points in April 2020 to 115 points in January 2021, up 9.5%. It then continued its rise at a faster pace and reached 218 points in December 2022, up 90%, before dropping to 156 points in March 2023, down 28%. Milk is at 156 points on the index in March 2023, which is less than 5% higher than it was in January 2014 over eight years earlier.
230
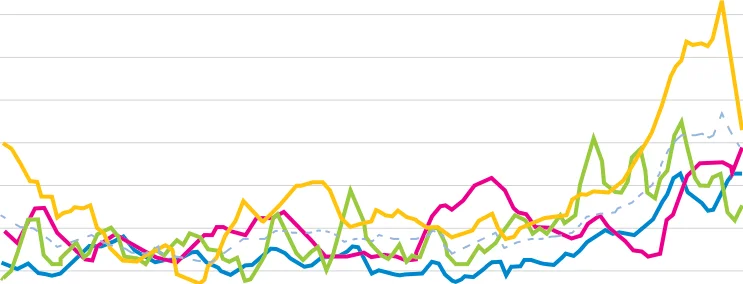
Figure 2.6 Agriculture Output Price index, Jan 2014 - March 2023 (Base 2015=100)
210
190
170
150
130
110
90
70
2014 Jan
2015 Jan
2020 Jan
2021 Jan
2022
2023 Mar
Cattle Pigs Milk Agricultural output price index
Source: CSO
The table below highlights these longer-term changes and while outputs have generally increased by between 35% and 40%, inputs over the same period have increased by over 50%.
Table 2.1 Change in Price Index for Agriculture Inputs and Outputs Between January 2021 and March 2023
| Agriculture Inputs 2021 Jan 2023 March Change | |||
|---|---|---|---|
| Input price index | 103 | 155 | 50% |
| Energy | 98 | 156 | 59% |
| Electricity | 110 | 219 | 99% |
| Fertilisers | 79 | 210 | 165% |
| Feeding stuffs | 112 | 170 | 51% |
| Agriculture Outputs | |||
| Output price index | 107 | 146 | 37% |
| Cattle | 98 | 136 | 39% |
| Pigs | 106 | 147 | 39% |
| Sheep | 112 | 120 | 7% |
| Milk | 115 | 156 | 36% |
Source: CSO
Terms of Trade The agricultural terms of trade index is the output price index expressed as a percentage of the input price index (all percentage changes have been calculated on actual figures before the index is rounded to one decimal place). The terms of trade indicate the trend in the level of margin that is available to the farmer. Over the past seven years, since 2015, the terms of trade have fallen in 2016, 2018, 2019 and 2022, indicating that there was a smaller level of margin than in the previous year. In 2017, 2020 and 2021, the terms of trade increased and in these three years farm incomes tended to rise.
The terms of trade in 2022 compared to 2021 is negative, -6.2%, indicating that there is a smaller margin available to the farm in 2022. This is because the input index rose by more than the output index, 34.7% compared to 26.4%.
Table 2.2 Annual Terms of Trade, 2015 – 2022 Base 2015 = 100
| 2015 2016 2017 2018 2019 2020 2021 2022 Change 2020/2021 | |||||||||
|---|---|---|---|---|---|---|---|---|---|
| Output | 100.0 | 95.1 | 106.5 | 104.4 | 103.3 | 104.0 | 116.0 | 146.7 | 26.4% |
| Input | 100.0 | 97.9 | 98.2 | 102.7 | 105.0 | 102.2 | 111.6 | 150.3 | 34.7% |
| Terms of Trade | 100.0 | 97.2 | 108.4 | 101.6 | 98.3 | 101.7 | 103.9 | 97.5 | -6.2% |
Source: CSO

Figure from page 39
Pages 36–39 · View in original PDF