2.2 National Farm Income (Operating Surplus), 2022
There are two main sources of national farm income. One is the Central Statistics Office (CSO) release called Output, Input and Income in Agriculture, which is examined here, and the second is the Teagasc National Farm Survey, which is examined later in this chapter.
Three times each year, the CSO release a statistical publication called Output, Input and Income in Agriculture (OII). The first or advance estimate is generally released in early December of the reference year. This is based on the data available at the time, which is not fully complete. The Advance estimate is updated in March of the following year when the Preliminary estimate is published. This incorporates all additional up-to-date information that has become available by that time. In June, the Final estimate of the agricultural accounts is prepared based on the complete set of data. The OII sets out the estimated value of goods output at producer prices for livestock, livestock products and crops. It estimates the cost of intermediate consumption or inputs, includes the value of subsidies and estimates the operating surplus or estimated aggregate farm income.
In 2022, the total estimated value for goods output at producer prices was a record €12.3 billion, up from €9.6 billion in 2021, a 28% increase. This comprised of €4.5 billion for livestock, €5.1 billion for livestock products (mainly milk) and €2.6 billion for crops which include cereals, horticulture, and forage plants such as silage & hay used on the farm. The value of milk output rose by 48% or €1.6 billion in 2022 driven mainly by very strong prices for dairy products on the world market. Goods output at producer prices have grown at an average rate of over 6% per annum since 2000, when they were valued at €4.9 billion.
While the value of goods output at producer prices increased by 28% in 2022, a significant portion of this additional value to farmers was taken up by a 29% increase in intermediate consumption. This is the value of all goods and services used as inputs in the production process, excluding fixed assets. Input prices were rising since 2021 but following the illegal invasion of Ukraine by Russia in February 2022 input prices such as energy, fertiliser and animal feed increased at a much faster rate. Feeding stuffs and fertilisers account for almost 45%, or €3.5 billion, of total intermediate consumption in 2022, up from €2.4 billion in 2021. Spend on fertiliser rose by 100% in 2022 compared to 2021, to €1.2 billion, up from €0.6 billion. Total,
spend on intermediate consumption in 2022 was €7.9 billion, up by €1.8 billion on the 2021 spend of €6.1 billion.
The operating surplus was €4.7 billion, up 28% on the 2021 value of €3.7 billion. The operating surplus is an estimate of farm income before deductions for interest payments on borrowed capital, land annuities and rent paid by farmers to landowners for the use of their land. This is the fourth year in a row that the operating surplus has increased, up 3.7% in 2019, up 10.1% in 2020, up 16.7% in 2021 and up 28.3% in 2022. In 2018 operating surplus was €2.8 billion and in 2022 it had increased by over 70% to €4.7 billion.
Total subsidies, less taxes on products and production, provide a significant portion of operating surplus. In 2022 they were worth €1.9 billion, up from €1.7 billion in 2021, or 12.9%. The pig exceptional payment scheme, along with the tillage incentive schemes, helped boost the subsidies in 2022.
Figure 2.1 Goods Output, Intermediate Consumption, Net Subsidies and Income, 2013 - 2022
€14
€12
€10
Billion
€8
€6
€4
€2
€0
Goods output at
Intermediate Comsumption
Subsidies less taxes
Operating surplus
producer prices
on products and
production
2013 2014 2015 2016 2017 2018 2019 2020 2021 2022
Source: CSO
Operating Surplus (OS)
Operating Surplus (OS)
Operating surplus is defined and calculated by the CSO by subtracting compensation of employees from farm income accruing from farm output. The figure is comprised of the operating surplus earned by farmers and that earned by agricultural contractors. It is an estimate of income before deductions for interest payments on borrowed capital, land annuities and rent paid by farmers to landowners for the use of their land. It does not include income from non-farming sources and may not be equated to household income.
Operating surplus is defined and calculated by the CSO by subtracting compensation of employees from farm income accruing from farm output. The figure is comprised of the operating surplus earned by farmers and that earned by agricultural contractors. It is an estimate of income before deductions for interest payments on borrowed capital, land annuities and rent paid by farmers to landowners for the use of their land. It does not include income from non-farming sources and may not be equated to household income.
Agriculture Output in Europe Key Figures on the European Food Chain 2022 edition, published by Eurostat, provides a selection of indicators concerning the food chain, from primary production in agriculture and fisheries through to consumption. Data is presented for the European Union (EU), its individual Member States and European Free Trade Agreement (EFTA) countries. This publication may be viewed as an introduction to agriculture, fisheries and food chain statistics. It provides a
starting point for those who wish to explore the wide range of data that is freely available on Eurostat. Most datasets available in Key Figures on the European Food Chain are from 2020, with some from 2021. More up-to-date data on European agriculture production can be found at the agriculture page on Eurostat where data tables are updated during the year as data becomes available.
According to Eurostat data, Ireland has the tenth largest amount of agricultural output, valued at producer prices, among the EU 27, although it is the fifteenth largest country. France, which is the largest country in the EU 27, produces 18% of the agricultural output in the Union. The top five EU countries for agriculture output are France, Germany, Italy, Spain and Poland. Together they are responsible for 65% of total EU 27 agricultural output. Interestingly the Netherlands and Denmark, which have the sixth and seventh smallest land mass in the EU27, respectively produce the sixth and eight most agricultural output of the 27 EU countries.
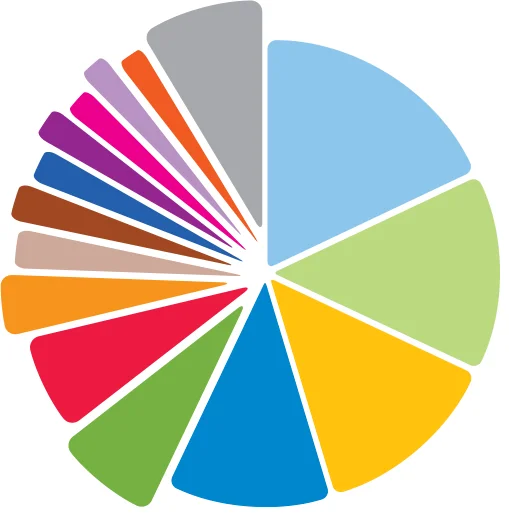
Figure 2.2 Proportion of Agricultural Output by Country in EU27, 2022
n France 18%
n Germany 14%
n Italy 13%
n Spain 12%
n Poland 7%
n Netherlands 7%
n Romania 4%
n Denmark 3%
n Greece 3%
n Ireland 2%
n Belgium 2%
n Portugal 2%
n Austria 2%
n Hungary 2%
n Other 9%
Source: European Accounts for Agriculture
Ireland’s farmers are mostly animal farmers with a small number of tillage farmers. Animal output, as calculated by Eurostat includes meat, milk, eggs and other animal products. As this covers a significant amount of Irish agriculture, it is not that surprising to see that Ireland produces the seventh highest animal output at producer prices in the EU27, at 5% of total animal output. Germany and France have the highest value animal output at 17% and 15% respectively. Spain, Italy and Poland are all close to 10%, while the Netherlands is at 7%, followed by Ireland at 5%.
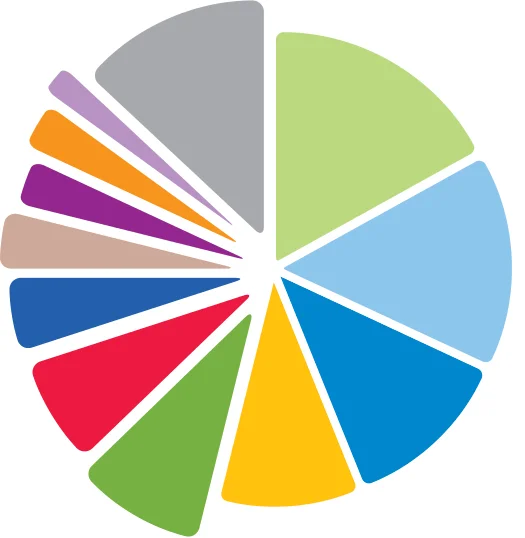
Figure 2.3 Proportion of Animal Output by Country in EU27, 2022
n Germany 17%
n France 15%
n Spain 12%
n Italy 10%
n Poland 9%
n Netherlands 7%
n Ireland 5%
n Denmark 4%
n Belgium 3%
n Romania 3%
n Austria 2%
n Other 13%
Source: European Accounts for Agriculture
Looking at crop production in the EU, the largest proportion comes from France at 20%, followed by Italy at 14%, Spain at 14% and Germany at 12%, the top four countries combining to account for 59% of crop output in EU27 during 2022. Ireland ranks in 19th position for crop output in EU27, accounting for just 0.8% of total output.

Figure from page 35
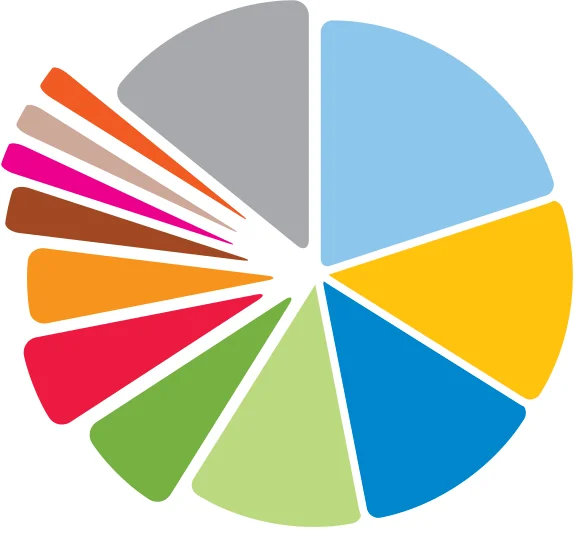
Figure 2.4 Proportion of Crop Output by Country in EU27, 2022
n France 20%
n Italy 14%
n Spain 13%
n Germany 12%
n Poland 7%
n Netherlands 6%
n Romania 5%
n Greece 3%
n Portugal 2%
n Denmark 2%
n Hungary 2%
n Other 14%
Source: European Accounts for Agriculture

Figure from page 36
Pages 32–36 · View in original PDF