Understanding the Challenge
Figure from page 27
2. Understanding the Challenge
Our transport system must operate efficiently to secure the full benefits of Government investment. This can only be achieved by reducing congestion and overall demand for unsustainable journeys. By tackling these issues, other societal benefits can be unlocked through reductions in emissions and harmful localised pollutants.
Given the above, it is not surprising that the car is the dominant form of inland transport in all Member States compared with journeys by train, coach or bus. In 2018, travel by car accounted for 82.9% of passenger-kilometres7 across the EU, compared with 9.3% for coaches, buses and trolley buses, and 7.9% for trains. As of 2023, private cars made up 74.3% of total kilometres travelled8.
It is widely acknowledged, at a global level, that transport will be one of the most difficult sectors to decarbonise despite the scale of associated benefits, including to the economy and national competitiveness. Transport emissions are stubbornly difficult to reduce, compounded by an embedded reliance on private car use – nationally and internationally. Reflecting levels of car dependency across the EU, the average number of passenger cars per 1,000 inhabitants increased by 13.8% (from 501 to 570 passenger cars per 1,000 inhabitants) during the decade 2013-2023. (See Figure 3)
As previously mentioned, targets (if achieved) for the electrification of the vehicle fleet, along with an increasing penetration of biofuels in the fuel mix, could potentially help to reduce emissions in transport by circa 37% by 2030. The remaining 13% will largely be dependent on reducing kilometres travelled and a large-scale shift to more sustainable journeys. This translates to reducing the mode share of daily car journeys from over 70% to circa 50%, in parallel with an increase in daily public transport journeys by 130%, and an increase in daily active travel journeys by 50%.
Ireland was not immune from this trend in recent decades, with the number of licensed vehicles having increased by 250% from 915,000 in 1985 to 3.2 million in 2025. While the number of goods vehicles increased by 363% over this period, from 93,400 in 1985 to 432,460 in 2025, private cars accounted for most of this growth with an increase of 1.8 million vehicles. However, Ireland’s per capita ownership rate remains relatively low when compared to other EU Member States – indicating scope for additional growth and increased car dependency.
The level of change envisaged – over a very short period - is unprecedented. To provide some context, during the Covid crisis in 2020 when the country experienced a number of ‘lock downs’ and where long-distance travel by citizens and many businesses was severely curtailed, transport emissions fell by only 16%. While emissions from road freight were reduced, given the impacts of restrictions on certain industries (e.g., construction), goods vehicle traffic remained largely unhindered.
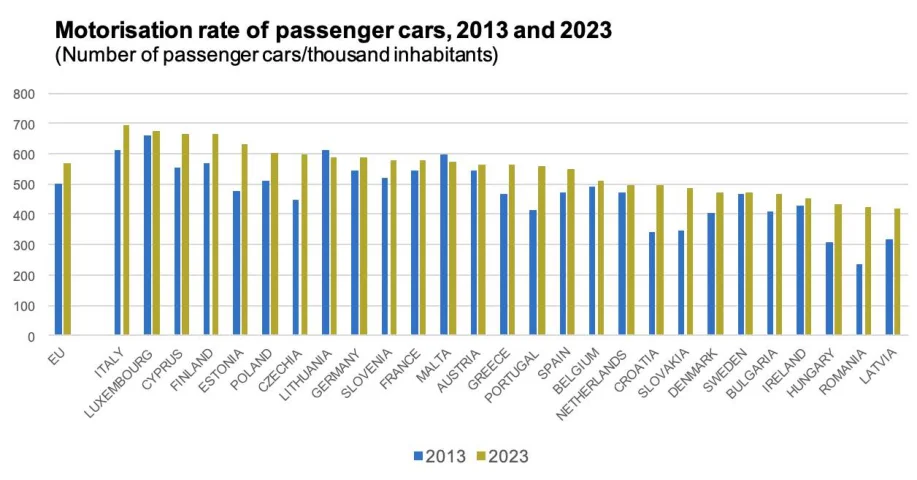
Figure 3: Motorisation Rate of Passenger Cars, 2013 and 2023
7 EU Passenger Kilometres by Car
8 https://data.cso.ie/table/THA10
The following table from the SEAI’s Energy in Ireland Report 2025 is indicative of the emissions profile for the transport sector, with the largest share emanating from private car journeys (40.5%), freight (16.3%), and Light Duty Vehicles (5.8%) in 2024. Any effort to reduce kilometres travelled must focus on these sub-sectors.
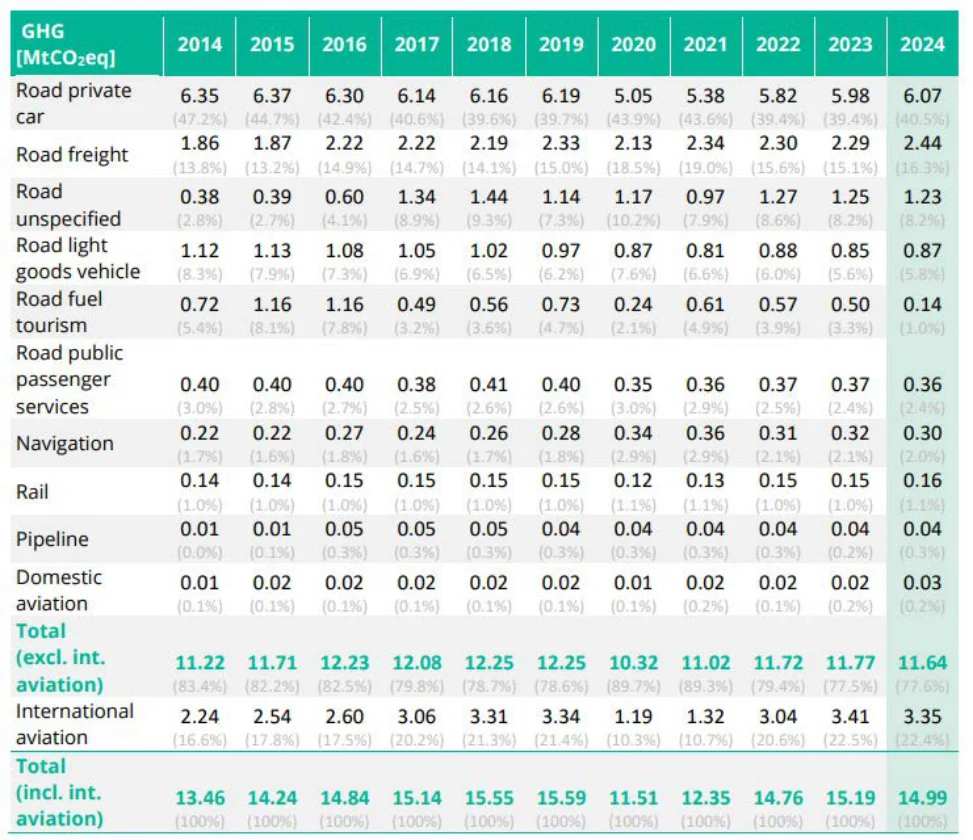
Figure 4: Quantities and shares of transport CO2eq emissions by subsector, including GHG emissions from direct combustion
Figure 4: Quantities and shares of transport CO2eq emissions by subsector, including GHG emissions from direct combustion and indirect GHG emissions from electricity use (share)
In the year preceding Covid (2019), total kilometres travelled in Ireland was 47.1bn kilometres. In 2023 (the latest available data), total vehicle kilometres travelled were 47.3bn meaning that each vehicle travelled on average 15,854 kilometres. The following table indicates the breakdown of kilometres travelled between private cars, goods vehicles and others.
Total Vehicle KM, 2005-2023
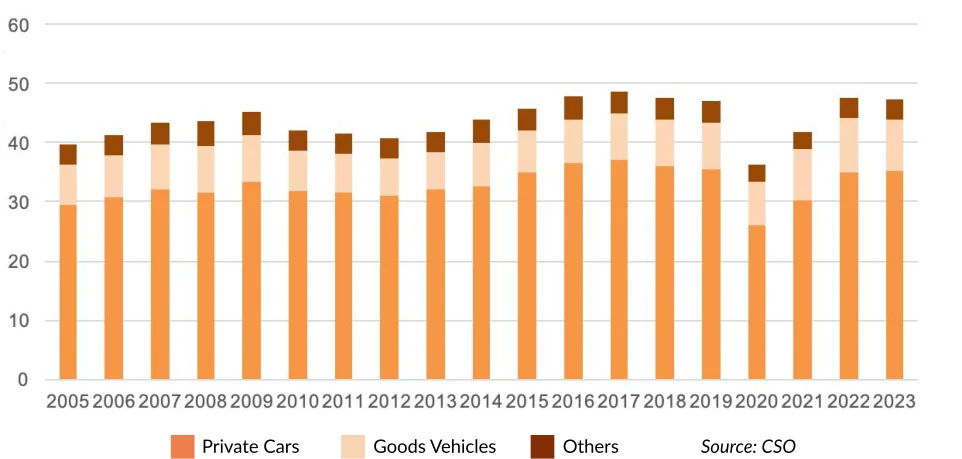
Figure 5: CSO Data on Total Vehicle Kilometres
While average total kilometres travelled is lower for private cars than for goods vehicles, public service vehicles, and tractors and machinery, private cars accounted for over 77% of the total number of licensed vehicles and 74% of the total distance travelled in 2023. On average, each private car travelled 15,196 kilometres. In 2019, a year in which there was no travel curtailments, each private car travelled on average 16,352 kilometres.
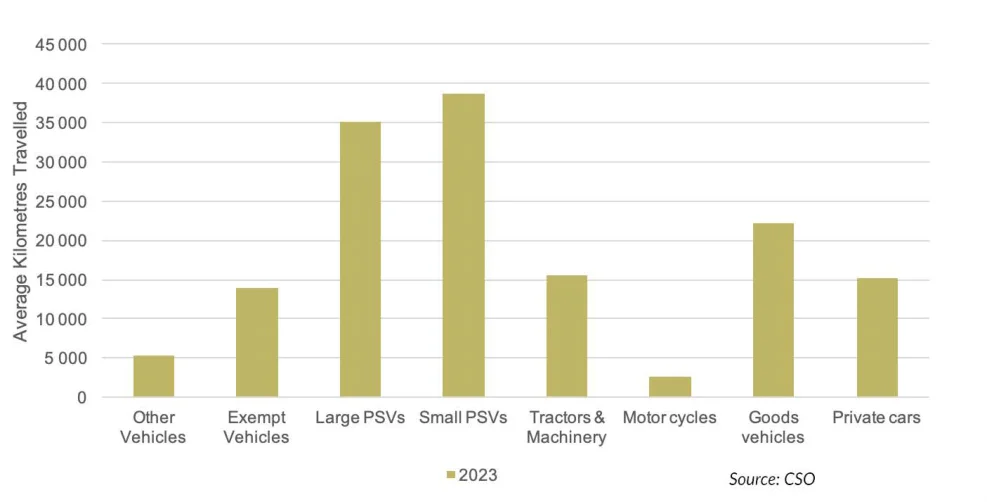
Figure 6: CSO Data on Average Kilometres Travelled by Vehicle
At a more granular level, data gathered by the NTA indicates the kilometres travelled is highly correlated to geographical areas. Taking the Greater Dublin Area as an example, there is a significant difference in kilometres (KM) travelled by people living in the GDA Hinterland compared with those in the Dublin City Centre.
| Annual Vehicle KM | Population | Annual KM/Person | |
|---|---|---|---|
| Inside the Canals | 508,000,000 | 156,500 | 3,246 |
| Canals to M50 | 4,838,000,000 | 705,700 | 6,856 |
| M50 to Metropolitan Boundary | 7,524,000,000 | 658,500 | 11,426 |
| Hinterland | 11,308,000,000 | 604,000 | 18,722 |
| Total | 24,177,000,000 | 2,124,800 | 11,378 |
Figure 7: Kilometres Travelled (GDA)
Nationally, according to the most recent National Household Travel Survey (NHTS) in 2024, 71% of journeys are taken by car.
Car
71%
Walk
Bus/Coach
Truck/Van
Cycle
2%
1%
Train/DART/Luas
1%
Other
Figure 8: Breakdown of National Journeys by Mode
However, the following shows that most trips that people make are over relatively short distances. According to the 2024 NHTS, approximately 69% of all trips taken nationally are for distances of less than 10km with 36% of all trips below 3 kilometres. Just 11% of journeys are for 30km or more.
| Distance | % |
|---|---|
| 0-0.99km | 10% |
| 1-2.99km | 26% |
| 3-4.99km | 14% |
| 5-9.99km | 19% |
| 10-19.99km | 15% |
| 20-29.99km | 6% |
| 30km+ | 11% |
| Average trip distance | 12.81km |
Figure 9: Breakdown of National Journeys by Distance
So, while the challenge to address car dependency – both practically and culturally - is significant, the above distances would suggest that there is significant scope for reducing car journeys in favour of other modes where sustainable alternatives are available and viable.
A key driver of the behavioural change needed is the relative cost and benefits to the individual and the availability of alternative options. Various techniques, including the National Transport Authority’s Regional Modelling System, are used to model likely responses to the relative costs of travelling by car versus other modes. However, it is evident from these models that travel demand is highly inelastic. This means that people tend to absorb very high-cost inflation before behavioural change occurs. Therefore, achieving the level of required modal shift from the car to more sustainable modes requires a significant change in awareness around the relative cost and benefits between modes - particularly as the car continues to be perceived as more convenient, more reliable and more cost effective for most journeys.
It is noteworthy that, using the NTA model, fossil fuel price increases are effective in bridging the cost competitiveness gap between the internal combustion engine (ICE) car and sustainable transport alternatives. Implementation of such measures, however, is more challenging given the potential impacts on cohorts of the population for whom sustainable alternatives are not available and/or where affordability is an issue, particularly in relation to buying Electric Vehicles (EVs). This is the challenge in designing the range of policy interventions that will cumulatively deliver the required behavioural change in a fair and equitable manner.
Pages 27–32 · View in original PDF