Public Attitudes to Demand Management Measures
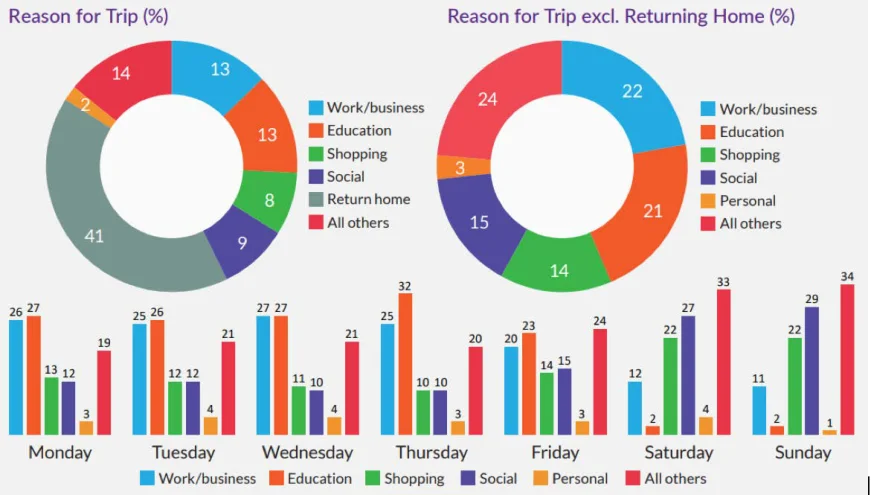
Figure 16: Reason for Trip: National
Travel Behaviour and Public Insights
Almost half reported living within a 15-minute walk of a doctor’s surgery (47%).
The source of trips was an important input to understanding and designing a Strategy that would support a reduction in demand for unsustainable journeys. For example, the above graphic is illustrative of the breakdown of national trips, showing some differences in patterns between weekdays and weekends as expected.In respect of trip lengths, the NHTS shows that 50% of trips are under 5km and 36% are under 3km. This underlines the clear potential to achieve a significant reduction in car kms for those shorter journeys through a variety of measures such as enhancing shared mobility provision, increased permeability, roadspace reallocation and active travel infrastructure, etc – across all journey types.
National Householder Travel Survey
The National Householder Travel Survey (NHTS) is a nationwide study of Ireland’s travel habits, which will be published annually from this year onwards as per a commitment in the SMP. According to the 2024 NHTS, work/business
is the main reason for travel (21%), followed by education (19%), social reasons (18%) and shopping (15%). The car is the most frequently used mode of transport, accounting for 71% of all trips, followed by walking (18%), bus/coach (4%), truck/van (3%), cycling (2%) and Train/DART/Luas at 1%.
Public Attitudes to Demand Management Measures
Those aged 55-64 are most likely to travel by car at 77%, followed by those aged 45-54 years (76%). Those aged 15-24 are least likely to travel by car at 59% and are more likely than any other age group to travel by bus/coach (10%).
While the NHTS provides a snapshot of actual travel behaviour, we also need to understand the attitudes and motivations that inform these choices. In that regard, the Department of Transport commissioned research in 2023 to test public sentiment and attitudes towards sustainable mobility policies generally, including various demand management measures as part of the development of this Strategy. Key headline findings, arising from a series of focus groups were:
The age cohorts most likely to walk are 15-24s and 25-34s (both 22%). Cycling is highest at 3% among those aged 4-14, 15-24 and 35-44. The majority of those surveyed for the NHTS 2024 live within a 15-minute walk of a shop (71%), pub or restaurant (64%), a bus stop (67%), a chemist/ pharmacy (58%) or a public leisure space (60%).
ᴏ Driving by car is the default option for the vast majority of people in Ireland today. This is seen to offer convenience and comfort and good time management. A key sentiment that emerged from the research was “If you own a car, you might as well use it!”
ᴏ Revisiting initiatives like the Tax Saver Scheme to reflect the hybrid working model and engaging with companies to encourage hybrid working, with leadership coming from the top of organisations and companies for Smarter Travel Schemes.
ᴏ Changing individual behaviour away from cars is a tough ask, especially when individuals feel that the impact of their behaviour is far less significant than the changes that can be achieved by industry and Government.
ᴏ Looking at incentives such as discounted costs for families traveling on public transport and/ or the use of short term ‘novelty’ discounts, which may help to introduce many people to the advantages of public transport.
ᴏ There is a lack of awareness around improvements made, and being made, to public transport services and their relative utility by those who don’t or rarely use it. Improvements that have been made can be overlooked by the public who drive and there is a need to strongly assert the improvements that are being made by Government.
ᴏ Drawing attention to progress that has been and will be made in public transport and highlighting all the positives to counteract established negative beliefs.
In summary, all of the research, policy analyses and focus group work referenced in this Chapter point to the wide range of benefits to be achieved from addressing travel demand and from supporting greater efficiency in our transport system. They also point to the range of potential measures available (see examples in Appendix 1), which informed the discussions of the expert sub-groups and the final set of recommendations in this Strategy.
ᴏ To avoid being seen as ‘anti-car’ and to get drivers on board, it’s vital that a wellconsidered and well-funded plan, showing integration and connection, is presented to people to win their confidence in non-car options.
ᴏ The health impact of car driving is largely overlooked. At a high-level, air pollution associated with emissions is acknowledged, but contributions to this at a personal level as well as the local and personal negative impacts, are poorly understood.
ᴏ Behavioural change will require a clearly thought-out pathway consisting of data, actions and ease of adoption. It will be important to emphasise the benefits, at every level, to encourage people to make changes. Change at a small level needs to be applauded but underpinned by a sense of urgency.
The research also suggested certain longer-term opportunities such as:
ᴏ Highlighting a positive plan to enable the public to lessen their reliance on car usage. People need to know that it can be done.
ᴏ Reiterating existing initiatives that are available to encourage non-car travel: 90-minute journey, rebalanced public space to create safer streets in cities, Bike to Work etc.
Pages 75–76 · View in original PDF