International Case Studies
International Case Studies
The WPL charge started at £288 per annum per liable car parking space and was increased each year by inflation along with a three-year accelerator. The cost per space for the 2023/24 period is £522. Nottingham City Council included certain exemptions and discounts in the Scheme.
Nottingham, UK: Workplace Parking Levy
Measure Impact
Nottingham, UK, addressed carparking through the introduction of a workplace parking levy in 2011 which currently operates at 100% compliance. A lengthy process for the city, it took four years to get from business case to implementation. Nottingham prioritised public and industry engagement throughout the planning and development process and continued this through to implementation, providing access to supports for businesses in travel and transport planning.
As the Nottingham WPL was introduced as part of a wider strategy to reduce car use, the impact of the WPL in isolation cannot be identified. However, the impacts of the wider strategy have been monitored and reported, from which the likely impacts of the WPL can be discerned, for example:
ᴏ Liable parking space numbers reduced by 25% initially and then levelled out.
ᴏ 80% of employers now pass the levy charge onto employees – covering just over half of the liable spaces.
ᴏ The public transport improvements paid for by the levy create better alternatives to the car. Around 40% of workplaces are served by the tram and 55,000 employees use it to commute to work.
Background
ᴏ Traffic has declined by 9% since 2004.
Nottingham introduced a Workplace Parking Levy (WPL) in the city in 2011. WPL is a charge on the occupier of premises (typically the employer) for the number of parking spaces they provide that are used by employees, business customers, business visitors, and anyone parking in the course of their business or education (including students). A WPL is a pricing mechanism intended to help directly manage car demand and generate revenue streams that are often ringfenced to be invested in local sustainable transport. There is an incentive for employers who are subject to the levy to reduce the number of parking spaces they provide.
ᴏ Reducing car parking demand leads to redevelopment potential on brownfield sites, which reduces demand on greenfield sites which are normally more difficult to serve by sustainable modes. This has been very important for some large employers such as the two universities.
ᴏ The number of employers with travel plans has doubled since 2012 – one third of larger employers now have travel plans.
There is no evidence of any significant negative economic impact in Nottingham. WPL has raised almost £90 million in 10 years.
Multiple benefits are associated with WPL, including reduction in car trips and the associated air pollution, carbon emissions and traffic. These charges applied can generate funds that can be invested in sustainable transport and lower demand for car spaces providing opportunities for alternative land uses. Indirectly, a WPL can help manage the wider impacts of traffic on communities and the environment, such as air pollution and poor land utilisation.
Recommendations and Lessons Learned
There are several takeaways regarding the Nottingham Workplace Parking Levy, including:
ᴏ Parking levies are best applied in areas that are well suited to public transport investment or are already served by public transport, thereby offering an alternative.
ᴏ Timeline for introduction can be lengthy with a need to allow for constructive consultation. It is important to clearly identify the allocation of funds raised by the WPL, and ideally use the monies raised to invest in sustainable transport as an alternative to the car.
design and the ability to grow active travel mode share while supporting economic development. Amsterdam also runs two on-demand transport services in AMLflex and Mokumflex and takes an economic approach to the allocation of urban space. Public space is described as holding more economic value than ever before. Streets, squares and parks are not only a location requirement for residents and companies, but also a production environment.
Amsterdam
Amsterdam’s car and bicycle parking development standards encourage residents to own more bikes than cars, while their approach to the design of public spaces makes it simple and affordable to create high quality public spaces.
Amsterdam, the Netherlands has standardised and simplified the planning processes in urban areas to provide a transport system that prioritises sustainable modes. Sustainable mobility (via active travel and on-demand public transport) is seen as the preferred option to users due to the transparency of planning processes and the prioritisation of craftmanship, innovation and user experience across design and implementation.
Parking standards in Amsterdam are divided into three zones:
ᴏ “A localities” (purple), have very good public transport accessibility and easy access to intercity train stations, so the municipality only prescribes a maximum parking standard.
ᴏ “B localities” (grey), have good public transport, but are further away from intercity stations. In these locations, the municipality applies both minimum and maximum parking standards.
Background
The Amsterdam metropolitan area offers a lot of lessons learned to Ireland with regards to urban
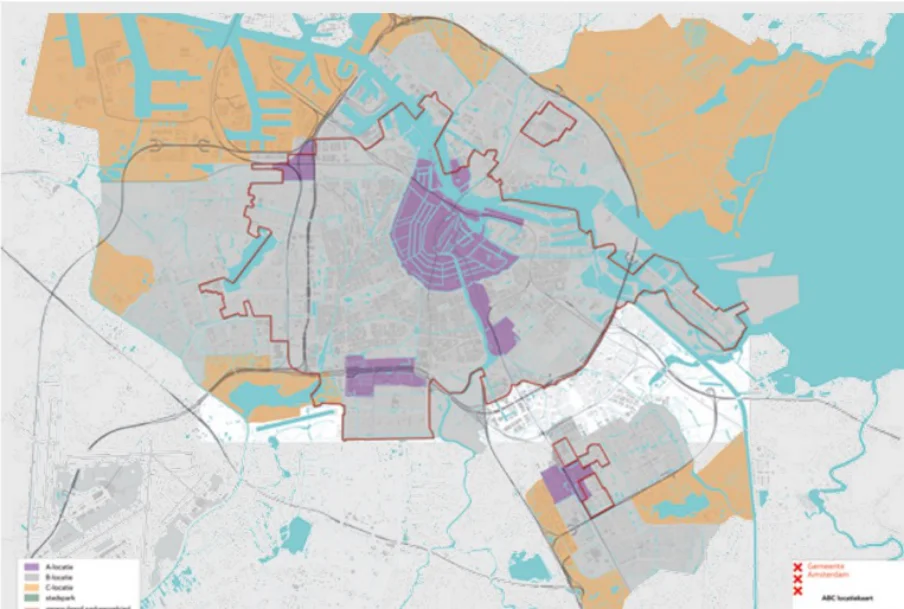
Figure 23: Zonal mapping of Amsterdam car parking standards
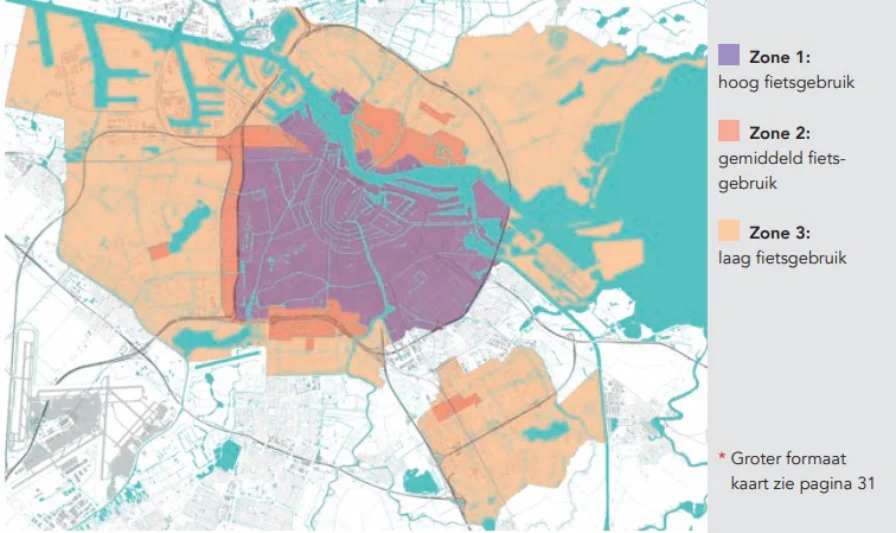
Figure 24: Zonal mapping of Amsterdam bicycle parking standards
ᴏ “C localities” (orange), are more rural areas that don’t have good public transport options. Parking numbers in these areas are more customised – the municipality may require that parking is provided on private property, but parking on the street may also be allowed.
Lessons Learned
The standardisation and simplification of urban design processes can improve the speed and quality of completed street redesigns. Framing sustainable transport and urban space developments from an economic perspective, attracting investment and young knowledge workers and encouraging retail and hospitality spending makes it easy to get stakeholders on board with changes to the status quo.
Bicycle parking standards similarly vary by area of the city, with Zones 1, 2, and 3. Bicycle parking is always provided as a minimum standard. For residential developments, individual bike storage facilities are the preferred parking method, but communal storage facilities are permissible. In practice, this typically means that individual storage is most logical for low-rise housing, while collective storage is most logical for multi-storey housing. All of these standards are higher than car parking standards, encouraging households to own multiple bikes, but not multiple cars.
Amsterdam’s parking standards that encourage residents to own more bikes than cars and require developers to support the municipality’s reduction of on-street car parking is a cost-effective way to reduce car usage and improve the quality of the public realm. These standards cost very little for the municipality to enforce, while allowing them to completely transform streetscapes without removing the net amount of parking in the city.
Measure Impact
On-demand transport may have its place in the more rural and peri-urban areas of Ireland, and the possibility of partnering with private operators may make this form of transport a cost-effective way of bringing public transport to areas where traditional public transport is infeasible.
Car vehicle-kilometres travelled has largely stayed the same since 1990, despite its population growing approximately 25%. This would indicate that growth is being facilitated by public transport and active travel, rather than by private car.
Copenhagen Metro and Cycle Superhighway
The Copenhagen Metro is a light rapid transit system throughout the three municipalities of Copenhagen, Frederiksberg and Tarnby. The system operates 24/7 and is a world leading public transportation system. The metro system is served by a network of driverless trains and does not operate on a timetable but rather has fixed intervals (between 2-4 minutes) depending on the time of the day.
Copenhagen has rolled out ambitious and extensive public transport and active travel projects in an effort to promote modal shift and reduce car usage in the city. The delivery, and extension of, the Copenhagen Metro and the development of cycle superhighways can act as two examples of how large projects can influence travel patterns.
The cycle superhighways in Copenhagen are a coherent network of cycle highways across the capital region, where the needs of cyclists are given the highest priority in the road hierarchy. A cycle superhighway is defined by its location and physical qualities. The highways connect work, study, and residential areas as well as public transportation hubs making it easy to combine a commute with public transport. The superhighway network ensures a safe, smooth ride with fewer stops and increased safety with the aim to increase the number of commuters who bike 5-30km daily.
Background
The expansion of the metro network and the development of cycle superhighways in Copenhagen have resulted in a significant shift from car use in the city, while encouraging a transport network which is sustainable, fast and safe for all ages, persons and abilities.
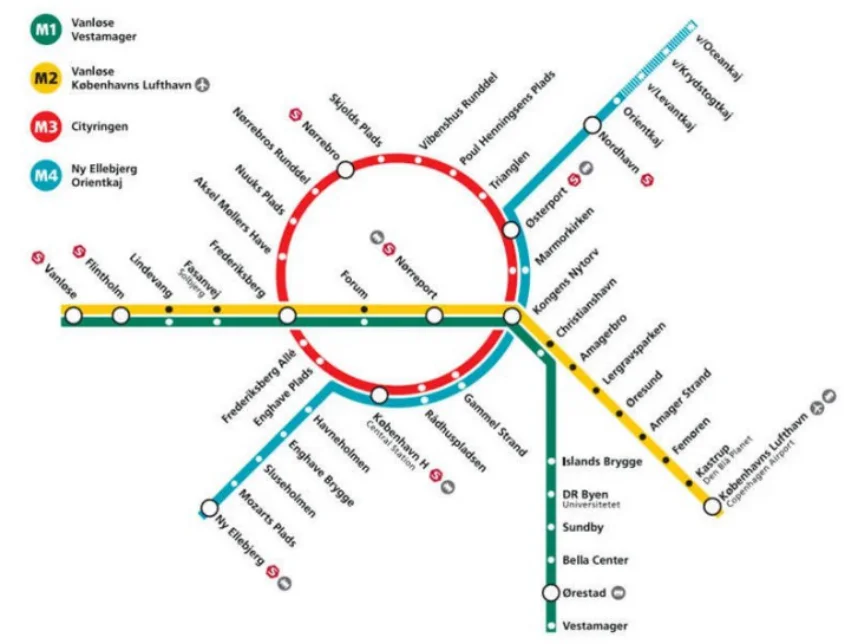
Figure 25: Copenhagen metro line network map
Measure Impact
Lessons Learned
Overall annual ridership of the metro system grew significantly between 2010 to 2019, from 52.5 million to 78.9 million. The expansion of the network, along with the existing network lines, has resulted in approximately 85% of citizens in Copenhagen having access to a metro or train station within 600 meters from their home, as well as being a part of the 75% of total resident journeys covered by foot, bicycle or public transport modes.
The use of public/private financing structures to develop a highly efficient and highly used metro network in the capital, which is possible through the re-development and renewal of urban areas and land, could be an avenue to support the heavy investment and financing required for transportation developments.
The development of cycle superhighways, combining new and existing cycle pathway infrastructure, could also work in the context of Ireland’s cities and their surrounding commuter belts. Through the improvement to existing cycling networks, there will be a reduction in travel disruptions caused by the provision of new routes.
After the development of the first 8 cycle superhighways in 2019, the following outcomes were found:
ᴏ 23% increase in number of cyclists when route is upgraded to a cycle superhighway.
Overall, across both projects, establishing clear frameworks, collaborations and partnerships were crucial for the successful implementation. User buy-in is equally important. Finally, the various forms of public and active travel modes in the city are well integrated to each other. Across the metro line, there are many stations which are shared by other s-train services in the city and are all well connected to bus routes and stops. Most stations on the network are fitted with bike racks, and bikes can be brought onto the Metro. The cross integration across the different transport offerings is something Ireland could seek to incorporate in their own travel network, to make the utilisation of multiple forms of public and active travel modes for users easier, and more accessible.
ᴏ 14% of the increase in cyclists are from new cyclists that previously travelled by car.
In terms of environmental benefits, the development of the 45 superhighways are projected to result in annual reductions of 1,500 tonnes of CO2 emissions per year, as well as leading to an avoidance of 2,500 kg of NOx emissions per year.
Outside of emissions reduction, wider benefits include reductions in hours spent in traffic, reductions in commute times, reductions in car journeys, reductions in public cost spend due to a reduction in sick days taken due to the wider health benefits of cycling and economic benefits resulting from reduced congestion.
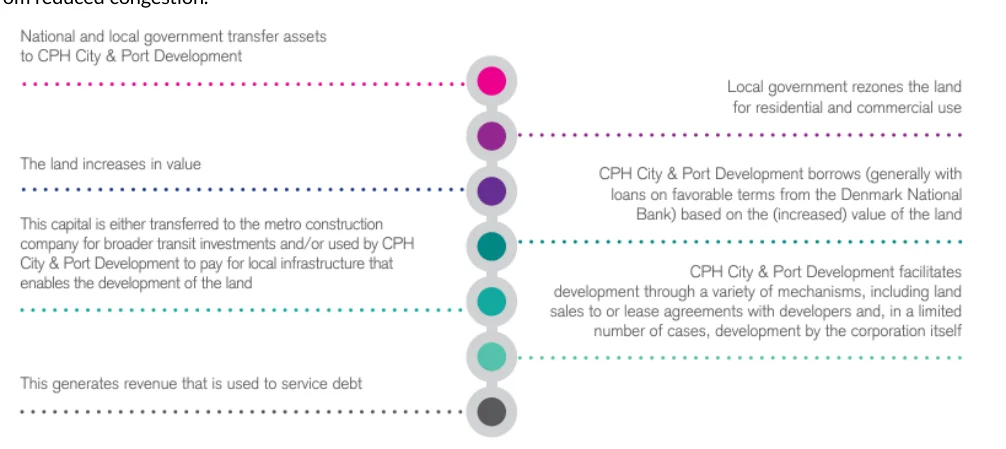
Figure from page 150
Figure 26: Financing model for metro expansion
New Zealand Road User Charging
Road user charging apples to both heavy duty vehicles (HDVs) and light duty vehicles (LDVs) in NZ. Under the current system, operators of all vehicles that do not use a fuel that is charged Fuel Excise Duty (FED) are subject to paying road user charges (note Petrol vehicles pay FED). Therefore, diesel vehicles and most recently LDV Electric Vehicles (EVs) pay road user charges. Currently, road user charges for LDVs are NZ $76 per 1000 Km prepaid licence for a vehicle <3500 kg (€0.043 cents/km). NZ petrol excise duty is currently charged at $0.70 per litre43 (approx. €0.043). The cost of road user charging for HDVs is greater (from €82 - €1,087 per 1,000 km) and varies depending on vehicle type and weight)44.
New Zealand has long been a pioneer of road user charging (RUC). Introduced in 1978, RUC in New Zealand is mature and the ringfenced revenue is used to maintain the country’s extensive road network and to fund the New Zealand Transport Program (NZTP).
Background
New Zealand (NZ) is one of the pioneers in road user charging having first introduced it in 197842. From its introduction which was initially driven by a need to generate revenue to fund road maintenance, the NZ road user charging system is now also a funding source for the land transport system. Its core concept is a road user charging approach based on vehicle’s distance travelled (i.e. it does not vary by time and location) and contribution of these funds to transport investment, operations and maintenance.
NZ provides a number of key considerations and potential lessons learnt for other jurisdictions, such as Ireland, considering the implementation of a road user charging system.
Measure Impact
The NZ road user charging system generates a significant revenue stream ($NZD 2 billion, equivalent to €1.1 billion, in the 2020/21 financial year). This revenue supports (and is ringfenced for) investment in road maintenance,
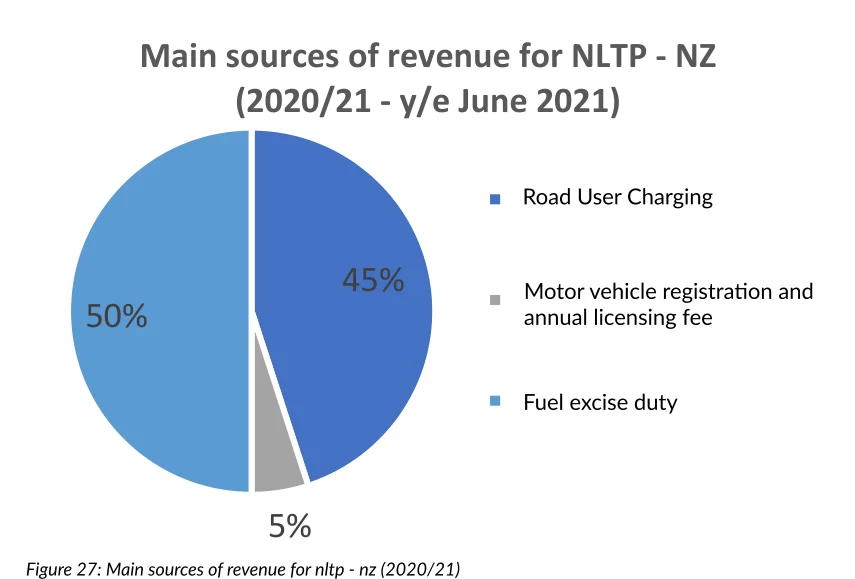
Figure from page 151
Main sources of revenue for NLTP - NZ
(2020/21 - y/e June 2021)
Road User Charging
45%
Motor vehicle registration and annual licensing fee
50%
Fuel excise duty
5%
42 First introduced via the Road User Charges Act (“RUC Act”), 1977
43 Road user charges: light vehicles (Factsheet 38) | Waka Kotahi NZ Transport Agency (nzta.govt.nz), Rates of petrol excise duty and
road user charges | Ministry of Transport
44 RUC rates and transaction fees | Waka Kotahi NZ Transport Agency (nzta.govt.nz)
subsidies in public transport, enforcement, and road safety. The NZ Road user charging system materially contributes to the funding for broader National Land Transport Program (NLTP) objectives including transport infrastructure investment, maintenance and road safety.
alternative road user charging approaches such as tolling which generally costs considerably more.
Enforcement: The ‘honour system’ supported ᴏ by odometer readings and ad hoc Police checks is a simple and low-cost form of enforcement.
Furthermore, under the current system vehicles are charged according to their overall use of the road network and the associated costs they impose, this system has gained general public acceptance in terms of equity, and has now been in operation for almost 50 years.
Lessons Learned
Case studies such as this one are important for Ireland to consider in the context of electrification and the implementation of other transport policies. Key lessons learned from the NZ case study include:
Equity: The ability to accurately allocate ᴏ charges based on road usage and to reduce road user charging for exempt vehicles/users which are subject to FED promotes equity and fairness, ensuring that those who use the roads more contribute proportionally
EV Transition: NZ provides an example of a ᴏ climate action focussed jurisdiction which is implementing road user charging on alternative fuelled vehicles including LDV EVs (introduced 1st April 2024/brought forward from initial date of 2030) and HDV EVs (31 December 2025) whilst continuing to endeavour to encourage the EV transition.
Public Awareness: The importance of ᴏ effective communication, engagement and consultation with key stakeholders can help in fostering public acceptance, enhancing its effectiveness and legitimacy.
Sustainable Funding: Transparent mechanisms ᴏ for reporting on and allocating revenues associated with road user charging can enable the public to appreciate how transport infrastructure/ services are funded, benefiting all road users.
Economically efficient collection system: ᴏ The operational cost of road user charging in NZ represents c. 1% of the total road user charging revenue which compares very favourably to the operational cost of
Pages 146–152 · View in original PDF