17 Strategy Outcomes
- Strategy Outcomes
It should be noted that the various outcomes presented in this section do not include the final demand management measures that will be developed and implemented under the Demand Management Scheme referenced in Measure CLIMATE2. The subsequent inclusion of those demand management measures will further increase the proportion of transport by sustainable modes.
17.1 Introduction
The Transport Strategy has been analysed and tested using the NTA’s Strategic Transport Model for the Eastern Region – the ERM. A large number of model runs were undertaken in an iterative manner throughout the strategy development process and then in its appraisal. The suite of runs used in the appraisal towards the end of the strategy development process comprises an appropriate representation of the Transport Strategy in modelling terms, in that the measures tested reflect those set out in the strategy report. Full details of the modelling process, including the other tests that were undertaken, are set out in a separate Modelling report.
17.2 How the Strategy Contributes to an Enhanced Natural and Built Environment
17.2.1 Consolidated Development
The Transport Strategy sets out a number of policies and objectives that directly benefit the policy of development consolidation. Chapter 8 contains a number of planning principles which the NTA will endeavour to ensure are incorporated into Development Plans and other planning policy documents, and are applied to development proposals, via our role as a prescribed body for planning matters.
The Transport Strategy has also been subject to a Strategic Environmental Assessment and Appropriate Assessment.
These analyses and assessments were carried out in accordance with the strategy objectives set out in Chapter 5 and the strategic environmental objectives. The combination of these assessments is reported in this section according to each objective.
The proposed transport network is focussed on facilitating the development of brownfield land primarily, while serving a number of major strategic medium density greenfield developments, which are contiguous to the built-up area of Dublin.
The impact of the strategy is measured against 2016 primarily. This is the last year for which comprehensive Census travel data is available. There are a number of indicators for which a comparison against a 2042 scenario without the strategy is more appropriate and these have been set out accordingly.
The Transport Strategy therefore facilitates the growth and development of the GDA in a manner which reduces urban sprawl; land take; damage to habitats; protects biodiversity; and avoids potential adverse effects on protected sites.
17.2.2 Public Realm and Placemaking
17.2.4 Carbon Emissions
In terms of contributing to a better built environment, the measures outlined in Chapters 8, 10 and 14 in particular place a great emphasis on the creation of people-centred urban areas – the transformation of streets as thoroughfares into places people wish to congregate and where movement on foot and by bicycle is safer and more convenient.
The Transport Strategy, in combination with other Government policies and programmes is forecast to lead to a reduction in carbon emissions from transport in the GDA from 3.2 MtCO2eq in 2018 to c.1.0 MtCO2eq in 2042 (Figure 17.1)
The development of the walking and cycling network, as well as the development of high-quality public transport across the GDA, including the reallocation of roadspace from private car to sustainable modes, will foster the development of Dublin’s urban villages and other towns, as well as maintaining and enhancing the role of Dublin City Centre. This placemaking approach will contribute to an enhanced urban environment.
MtCO2Eq
MtCO2eq Emissions
3.5

Figure 17.1: GDA Transport Emissions 2018 and 2042
3.0
2.5
2.0
17.2.3 Reduced Impacts of Traffic
1.5
1.0
Linked to the previous point, the reorientation of transport and land use planning away from the facilitation of the private car may contribute to this environmental objective by rebalancing the needs of this mode with those of the other modes across the settlements of the GDA. This would lead to improved air quality; greater roadspace reallocation to sustainable modes, and the improvement of the visual environment by reducing the effects of cars parked – both on-street and in off-street car parks – which can dominate urban environments.
0.5
0.0
2018 2042
17.2.5 Air Quality
The Transport Strategy, in combination with other Government policies and programmes is forecast to lead to a significant reduction in air polluting emissions compared to 2016. (Table 17.1).
Table 17.1: Air-polluting Emissions 2016 and 2042 (Kg)
taken as a panacea for all noise issues as friction between tyres and the road surface contributes a significant proportion of traffic noise and EVs can cause increased noise in this regard due to their greater weight. As such, the most effective way to reduce the population exposed to traffic noise is to reduce traffic in urban areas.
| NO X | NO 2 | PM10 | PM2.5 | |
|---|---|---|---|---|
| 2016 | 7,182,430 | 2,234,190 | 537,350 | 357,300 |
| 2042 With Strategy | 1,217,850 | 259,640 | 445,270 | 247,590 |
| Reduction | -83% | -88% | -17% | -31% |
Overall the Transport Strategy, in combination with other Government policies and developing technologies, is forecast to lead to a reduction in the numbers of people in the GDA being exposed to high noise levels from transport.
17.2.6 Noise
17.2.7 Mode Share
The Transport Strategy leads to a significant reduction in the use of the private car for trips for all purposes (see following section). This is forecast to reduce the numbers of people exposed to unacceptable noise levels from traffic, in particular within urban areas.
The mode share data presented below reflects the strategic transport modelling exercises undertaken in the appraisal of the Transport Strategy. The on-going reallocation of roadspace to sustainable modes – both on a local case-by-case basis at various locations across the region, and as part of future sustainable transport schemes whose designs have yet to be determined – is not fully captured in this data but is likely to further increase the use of walking, cycling and public transport, by making these modes more attractive relative to the private car.
The number of goods vehicles travelling in the GDA is expected to increase as a result of growth over the period of the strategy. While this may lead to some localised impacts in terms of increased noise, it is forecast – in line with policies and objectives related to the management of Heavy Goods Vehicles – that these adverse effects would arise primarily on the national and strategic road network, rather than on local roads and as such, would not lead to a significant increase in the population exposure to high noise levels.
Additionally, and as stated at the beginning of this chapter, the mode share outcomes presented here do not include the final demand management measures that will be developed and implemented under the Demand Management Scheme referenced in Measure CLIMATE2. The subsequent inclusion of those demand management measures will further increase the proportion of transport by sustainable modes.
The electrification of the public transport fleet, in addition to the private car fleet and goods vehicles, is likely to lead to reductions in noise as electric vehicles are generally quieter than those using ICEs. In a similar way to the debate around emissions, however, the conversion of the fleet should not be
24 Hour Period
14.6% to 17.5%. In the Metropolitan Area, these figures are 17.0% and 19.7% respectively.
The Transport Strategy is forecast to lead to a significant reduction in car mode share for the GDA from 57.7% in 2016 to 48.6% in 2042 for all trip purposes throughout the day. The Cycling mode share for all trips over the 24 hour period is forecast to increase from 3.7% in 2016 to 11.5% in 2042 (Figure 17.2).
As stated at the beginning of this chapter, the mode share outcomes presented here do not include the final demand management measures that will be developed and implemented under the Demand Management Scheme referenced in Measure CLIMATE2. The subsequent inclusion of those demand management measures will further increase the proportion of transport by sustainable modes.
In Metropolitan Dublin, the mode share for car is forecast to fall from 52.4% to 41.9% for the 24hr period, with public transport forecast to increase to 19.7% and cycling to 14.1%. (Figure 17.3)
The numbers using public transport in the GDA over a 24 hour period increase by 39%, leading to a mode share increase from
Figure 17.2: 24Hr Mode Share for the GDA 2016 and 2042 Figure 17.3: 24Hr Mode Share for Metropolitan Dublin 2016 and 2042
60.0%
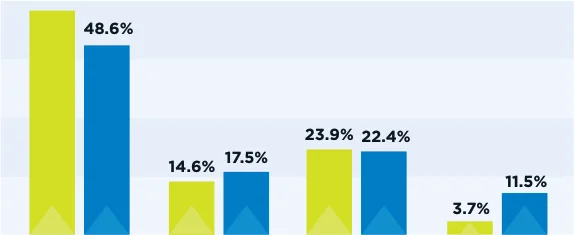
Figure 17.2: 24Hr Mode Share for the GDA 2016 and 2042
60.0%
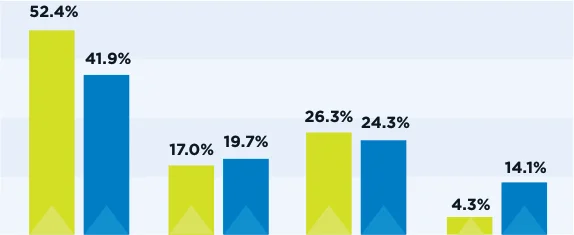
Figure 17.3: 24Hr Mode Share for Metropolitan Dublin 2016
45.0%
45.0%
30.0%
30.0%
15.0%
15.0%
0.0%
0.0%
Car Public Transport Walk Cycle
Car Public Transport Walk Cycle
2016 2042 With Strategy
2016 2042 With Strategy
AM Peak Period
In the AM Peak Period (7-10am) the mode share for car is forecast to drop from 54.8% to 43.8% in the GDA, with increases in public transport and cycling. (Figure 17.4).
In Metropolitan Dublin in the AM Peak Period, the mode share for car is forecast to drop from 47.9% to 36%, while the Cycling mode share is forecast to increase from 4.4% in 2016 to 15.0% in 2042. (Figure 17.5)
60.0%
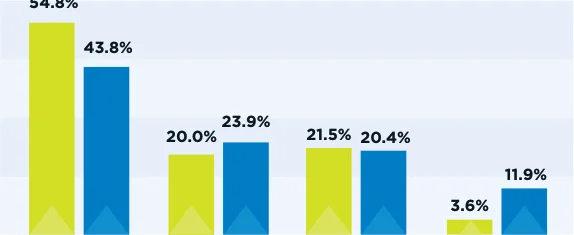
Figure 17.4: AM Peak Period Mode Share for the GDA 2016 and 2042
45.0%
30.0%
15.0%
0.0%
Car Public Transport Walk Cycle
2016 2042 With Strategy
Figure 17.5: AM Peak Period Mode Share for Metropolitan Dublin Table 17.2: 2042 Forecast Vehicle Kilometres Travelled by Select 2016 and 2042 Trip Purposes – 24 Hour Period
| Trip Type | 2016 | 2042 With Strategy | % Change |
|---|---|---|---|
| Business | 4,764,000 | 4,368,000 | -8% |
| Commute | 8,533,000 | 6,958,000 | -18% |
50.0%
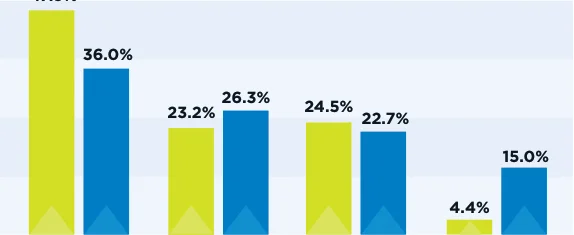
Figure 17.5: AM Peak Period Mode Share for Metropolitan Dublin
37.5%
25.0%
17.3 How the Strategy Leads to More Connected Communities and Better Quality of Life
12.5%
0.0%
Car
Public Transport Walk Cycle
2016 2042 With Strategy
17.3.1 Enhancing Community Interaction
The Transport Strategy sets out how all parts of the GDA can be brought closer together by sustainable transport investment. The ability of people to travel locally to district and neighbourhood centres and town and village centres by walking, cycling and public transport will be enhanced. The potential for greater levels of travel for social reasons across the city, suburbs, and within and between settlements across the GDA, will also increase as the full and integrated public transport network develops. The maintenance and growth of Local Link will reduce the effects of rural isolation.
17.2.8 Vehicle Kilometres
The Transport Strategy is forecast to lead to an 18% reduction in the number of vehicle-kilometres travelled to work compared to 2016 and an 8% reduction for business trips. These are shown in Table 17.2. Vehicle kilometres travelled is forecast to reduce by 10% for all trips including commercial vehicles, Heavy Goods Vehicles and Taxis in 2042 with the strategy in place compared to without the strategy.
Cycling and walking are inherently more sociable modes of travel because they facilitate a greater number of, and more
spontaneous, personal interactions than travel by private car. The reorientation of the transport network towards these modes, as set out in chapters 8, 10, 11 and 14 will ensure that people in the GDA will be provided with a walking and cycling environment which will greatly enhance their accessibility to services such as schools, health facilities, shops etc. at the neighbourhood and district level, promoting greater use of these modes.
Better reliability and associated reduced travel stress; and
Reduced rural isolation as a result of increased coverage and frequency of services.
17.3.3 Travel Time to Major Destinations
With the Transport Strategy in place in 2042, the number of people living within 30 minutes journey time to major destinations in the AM Peak increases significantly. 31% more residents of the GDA will be able to reach the City Centre in that time by public transport compared to a 2042 scenario without the transport strategy in place, and 45% more will be within 30 minutes of a major hospital. (Table 17.3 and Figure 17.6)
Social interactions are also more frequent on residential roads and streets with lower levels of car traffic. Through the strategy’s investment in all sustainable modes and measures to reduce car use in the urban environment, the potential for maintaining the high levels of walking and cycling, and for fostering closer communities is greater. Furthermore, the reallocation of roadspace to walking, cycling and public realm in particular, will reduce the impact of severance caused by the presence of wide roads for the exclusive use of vehicular traffic.
Table 17.3: Number of People within 30 Minutes Travel Time of Major Destinations by Public Transport
| Destination | 2016 | 2042 Without Strategy | 2042 With Strategy | % Change vs 2016 | % Change vs without 2016 |
|---|---|---|---|---|---|
| City Centre | 214,891 | 274,899 | 316,035 | 47% | 15% |
| Major Town | 504,422 | 676,742 | 895,880 | 77% | 32% |
| University | 468,349 | 677,554 | 792,486 | 69% | 17% |
| Hospital | 408,610 | 572,253 | 737,066 | 80% | 29% |
17.3.2 High Quality Public Transport Coverage
The level of public transport service on offer to an individual and the quality of that service is a major factor in that person’s quality of life. The Transport Strategy sets out a wide range of public transport measures which, in combination, would provide the people of the GDA with a significantly enhanced quality of life in this regard, in the following ways:
Reduced waiting times for public transport due to greater coverage of high frequency services;
Faster commutes by rail and by bus due to infrastructural improvements;
This reduction in casualties is due primarily to a reduction in car use, but does not fully take into account the enhanced safety impacts of better cycling and walking infrastructure, and roadspace reallocation, at the local level across urban areas. In this regard, it is anticipated that the implementation of the Transport Strategy will have a significant impact, not only on the numbers of collisions and injuries, but on the perception of safety among vulnerable road users.
Figure 17.6: Number of People within 30 Minutes Travel Time of Major Destinations by Public Transport – 2016, 2042 Without Strategy and 2042 With Strategy
900,000
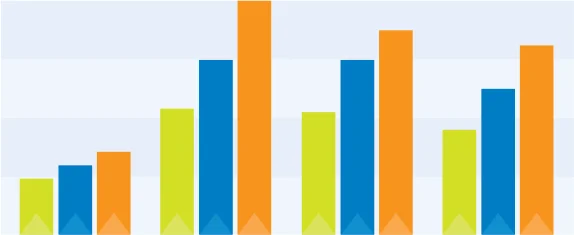
Figure from page 220
In terms of cycling and walking modes specifically, the rollout of segregated cycle routes on all the main corridors and elsewhere across the GDA, as well as the greenway network, will make this mode significantly safer and more accessible to people of all ages and cycling abilities. Additionally, improvements to the pedestrian environment, including better crossing facilities and footpaths, are likely to reduce collisions.
675,000
450,000
225,000
0
City Centre Major Town University Hospital
The Transport Strategy sets out a number of measures which will seek to ensure that the transport system is safe from a personal security point of view. This relates to security onboard public transport as well as ensuring that walking routes are safe at night with lighting, CCTV etc., as well as ensuring that people can get home safely throughout the night by expanding the amount of late night services including those operating 24hr a day.
2016 Base 2042 Without Strategy 2042 With Strategy
17.3.4 Safety
The implementation of the Transport Strategy is forecast to save 86 lives over its appraisal period and 333 serious casualties when compared to a scenario without the Transport Strategy, using available transport modelling and appraisal methods. For this indicator, the appraisal period is 30 years beyond the strategy end-year of 2042.
17.3.5 Access to Education
The Transport Strategy will be a factor, via the planning process, in ensuring that transport is a central consideration in the decisions around the location and design of new and extended schools in the GDA.
For existing schools, the Transport Strategy provides a range of public transport, walking and cycling improvements, including school streets, that will enhance accessibility to primary and secondary schools and commits to on-going engagement via the Green Schools programme.
economic value. While the focus can often be on the peak hour commute to work, the Transport Strategy ensures that all-day business travel; goods movement; off-peak and weekend trips to retail; trips for recreation and leisure etc. are all catered for.
By proposing a comprehensive and integrated transport network that serves all trip purposes by all modes at all times of the day, the Transport Strategy ensures that the value of the maximum range of activities will be harnessed and that the economic costs of congestion and suppressed demand due to inconvenience are reduced.
17.3.6 Promoting Culture and the Night-Time Economy
The implementation of the Transport Strategy will contribute significantly to the promotion of the cultural, hospitality and night-time economy of the GDA.
Furthermore, by providing for a step change in the capacity of the transport system, the Transport Strategy facilitates the more efficient concentration of growth into the City Centre and major centres of economic activity in the GDA. This agglomeration benefit comprises a virtuous circle whereby greater access by sustainable modes increases the potential for investment in our centres. This investment creates greater demand for movement and improvements to the transport system, which when delivered increases investment in turn.
By providing high-quality public transport services on a 24hr basis in Metropolitan Dublin; by improving the level of service offered by the SPSV sector; and by improving connectivity to the urban centres and rural areas by public transport, these parts of the economy – which operate primarily outside of the traditional transport peak hours – would benefit significantly.
17.4 How the Strategy Contributes to a Strong and Sustainable Economy
17.4.2 Business Trips
The Transport Strategy is forecast to facilitate a greater level of business travel, and a much greater amount of this travel is forecast to be undertaken by sustainable transport, with these modes accounting for 38% of business trips in 2042 with the strategy in place, compared to 26% in 2016. However there will be a slight increase in journey time effecting businesses still dependent on the car.
17.4.1 Fostering Economic Activity
The transport system is a critical factor in the economic health of city regions. It is essential that all trip purposes at all times are facilitated in an efficient manner as almost every journey has an
17.4.3 Trips to Work
Ride, facilitating greater numbers of commuters to reduce their use of the private car if they are travelling into Dublin or other major centres.
The transport system proposed in the Transport Strategy facilitates a far more sustainable pattern of commuting and is likely to remove a significant number of people out of congested networks onto free-flowing public transport and cycling networks, in particular in Metropolitan Dublin and the larger urban centres of the GDA.
Within the built-up area of Dublin, not only will the main radial corridors be enhanced, but the development of a proper, coherent and integrated network of high quality services will offer people an attractive alternative to the private car for a wide range of commuter trips to all areas and make that trip more attractive. The forecast shift from car to sustainable modes from 2016 to 2042 is shown in Figure 17.7.
For those outside the main centres, the reach of high-quality public transport into the GDA and Leinster will be much expanded under the Transport Strategy, including via Park and
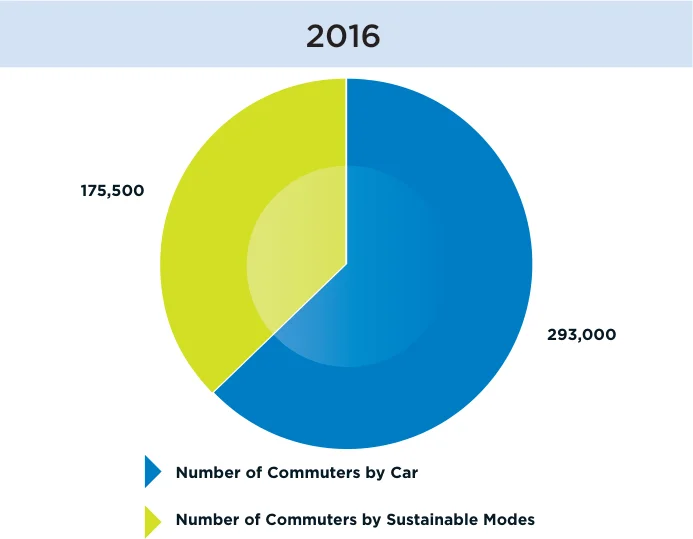
Figure 17.7: Trips to Work 2016 and 2042 With Strategy AM Peak
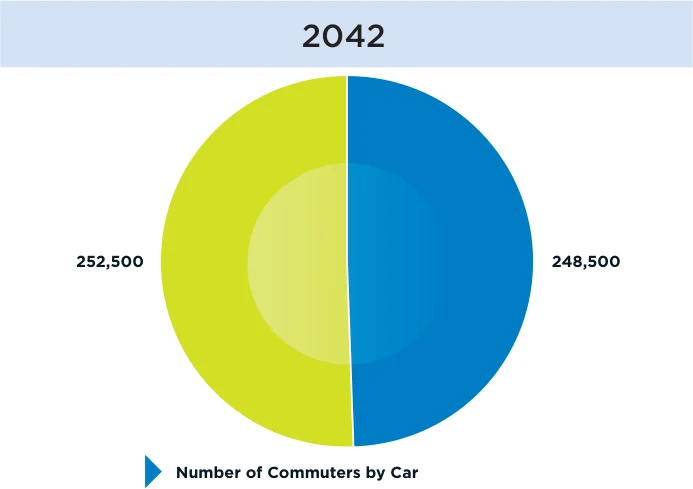
Figure from page 222
2016
2042
175,500
252,500 248,500
293,000
Number of Commuters by Car
Number of Commuters by Car
Number of Commuters by Sustainable Modes
Number of Commuters by Sustainable Modes
17.4.4 Goods Vehicles
17.4.6 Travel to Dublin Airport
While the modelling is focussed on movement of people, there are a number of outputs related to goods vehicles and freight movement generally.
The overall number of people that access Dublin Airport increases by 66% in 2042 with the strategy in place compared to 2016. The numbers travelling by public transport is forecast to almost triple to over 16,000 in the same period. It should also be noted that the number of car trips reduces significantly with the strategy in place in 2042 compared to a scenario without the strategy, with an associated increase in public transport. This clearly demonstrates the manner in which the measures proposed in the strategy, such as MetroLink and the Core Bus Corridors, protect and foster the growth of this strategic national asset. Similar outcomes arise for the AM Peak period. See Figure 17.8.
The Transport Strategy is forecast to facilitate more than double the amount of goods vehicles trips in 2042 compared to 2016. There is an increase of approximately 7 minutes in the average journey time for goods vehicles over that period. This indicator should be read in conjunction with the significant improvements in indicators for other trip purposes, and in particular in the context of the traffic management measures required to meet Climate Change targets.
The Transport Strategy sets out an ambitious programme of engagement between all of the major freight stakeholders and provides for the development of a freight strategy which will aim to deliver significant improvements to this sector, taking full account of emerging challenges such as Brexit and the recovery from Covid-19.
Travel time to Dublin Airport by car decreases by 13% in the AM Peak as a result of the Transport Strategy and by 21% by Public Transport compared to a scenario without the strategy in place in 2042. This primarily reflects the impact of Metrolink and the Core Bus Corridors. As more people use bus and light rail, the reduced numbers travelling by car also benefit from reduced congestion. While the time travelled by car increases relative to 2016, this must be viewed in the context of the significant shift to sustainable modes that the strategy enables.
17.4.5 Travel to Dublin Port
The Transport Strategy facilitates more than double the amount of vehicles accessing Dublin Port in the AM Peak compared to 2016. While the travel time increases, this clearly demonstrates that the strategy protects the strategic function of Dublin Port by ensuring that the radical interventions required across the GDA to meet climate change targets, do not adversely affect the movement of essential goods traffic to and from Dublin Port.
Figure 17.8: Total Trips to Dublin Airport from within the GDA Figure 17.9: Average Journey Time to Dublin Airport 2042 2016 and 2042 by Mode – Average Weekday AM Peak
26,000
70
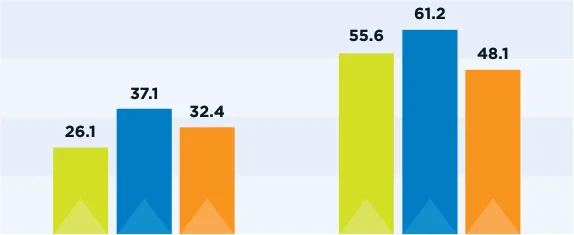
Figure 17.9: Average Journey Time to Dublin Airport 2042
Figure 17.8: Total Trips to Dublin Airport from within the GDA
19,500
52.5
13,00
35
6,500
17.5
0
0
Trips by Car Trips by Public Transport Total Trips
Journey Time Car Journey Time Public Transport
2016 2042 Without Strategy 2042 With Strategy
2016 Without Strategy
17.5 How the Strategy Fosters an Inclusive Transport System
Gender – the Transport Strategy aims to provide a more attractive transport system for women and girls through the following:
the provision of safer walking and cycling routes and infrastructure, including high quality public lighting and greater levels of passive supervision through better neighbourhood design; enhanced security on-board public transport vehicles; additional late-night public transport services, including sufficient taxis; and a better walking environment and public realm.
17.5.1 Equality
The Transport Strategy places great emphasis on inclusion and equality and it will be subject to a full Equality Impact Assessment prior to finalisation.
Chapter 9 sets out a statutory framework committing the NTA and all other agencies in the GDA to the implementation of measures to ensure the transport system meets the needs of all members of society, and to advertising and education campaigns which seek to inform people of specific needs of others.
Age – the Transport Strategy is forecast to lead to a more welcoming transport environment for older people through the following
the development of better walking networks and an enhanced public realm where motorised traffic is reduced; the provision of a 100% fully accessible public transport fleet; increased public transport frequencies and capacities; and
In terms of the transport system itself, the Transport Strategy commits the NTA and transport operators to the delivery of stations, stops, vehicles and passenger information ad signage that meet the highest standards required in this regard.
In relation to the 9 grounds of discrimination referenced in section 9.11, while the Transport Strategy is considered neutral under most of these, it is considered to address the following most positively:
the development of a safer cycle network.
17.5.2 Health
Disability – the Transport Strategy will contribute to the creation of an enabling transport system which allows people of all abilities to travel in the GDA by providing for the following:
The implementation of the transport strategy will foster a healthier transport culture in the following ways:
Better integration of transport and land use planning reducing the need to travel long distance for daily needs saving time, stress and money;
a 100% fully accessible public transport fleet; the reduction in the dominance of the public realm by motorised vehicles, including the reallocation of roadspace to other modes; protecting access to car parking for blue-badge holders as appropriate; constantly improving the manner in which transport information is disseminated to various groups with differing needs; increasing the frequency and capacity of public transport services; and the expansion of the Travel Assistance Scheme.
Electrification of public transport vehicles and a mode shift away from the private car which will contribute to an improvement in air quality and a consequent reduction in pollution related illness; and
Increased levels of walking and cycling leading to greater activity and reduction in prevalence of conditions such as obesity, in particular among schoolchildren who will benefit from an active commute.
The measures set out above will also contribute in a significant positive manner in addressing matters of socio-economic inequality, in particular by providing affordable alternatives to the private car, including serving rural areas by Connecting Ireland and Local Link.
17.5.3 Access to Jobs
The Transport Strategy is forecast to increase the numbers of jobs accessible to people living in the GDA by 30 minutes public transport journey time by 5%.
As such, the Transport Strategy, within its statutory remit, and in combination with the plethora of obligations set out under legislation, guidance and standards, commits all actors in this area to develop an inclusive transport system, building on the work done to date.
This, coupled with the improvements to the walking and cycling environment, demonstrates the manner in which the Transport Strategy will make it easier for people to access the workplace by sustainable modes without the need to own a car. Disadvantaged Areas.
Pages 213–226 · View in original PDF