strategy statement03 - 05
driver of the overall value chain as well as a generator of employment in itself. This is true both for foreign and indigenous firms.
In recent years, indigenous and FDI firms have performed well. However, in the aggregate, a substantial performance differential between the two segments remains in evidence. Relevant trends are now explored.
Figure 3 Permanent full-time employment in Irish-owned and in Foreign-owned enterprise
180,000
160,000
140,000
120,000
100,000
80,000
60,000
40,000
20,000
0
1991 1992 1993 1994 1995 1996 1997 1998 1999 2000 2001
Foreign Owned Irish Owned
1.11.2Foreign-owned enterprise
Over the period 1990 to 2000, employment in foreign-owned enterprises grew by over 70 per cent, but experienced a fall of 2.8 per cent in 2001. While job losses from the existing stock of FDI is not a new phenomenon, 2001 was the first time in 15 years that such losses exceeded job gains among IDA Ireland companies. Over the past two decades, the composition of the foreign-owned sector has changed markedly as the chemicals/pharmaceuticals, ICT, and international services sectors have grown in prominence. The contribution of chemicals/pharmaceuticals to trade is especially noteworthy.
Department of Enterprise, Trade & Employment
1.11.3Irish-owned enterprise
Between 1993 and 2000, employment in indigenous enterprise grew by almost 30 per cent and accounted for around 35 per cent of the net expansion in employment of the manufacturing and internationally trading sector. Employment growth in internationally traded services was faster, increasing more than fourfold between 1990 and 2000. The outstanding success of indigenous international services is the software sector.
While indigenous employment recovered in the 1990s, export performance was less impressive. Growth in manufacturing exports by indigenous firms between 1991 and 1999 was below the rate of output growth, and the share of output exported fell from 34.8 per cent to 31.3 per cent, perhaps reflecting the strength of domestic demand in the period.
Ireland’s gross expenditure on research and development has increased significantly in the period 1991 to 1999. However, the base from which it has grown is low by international standards. During this period Ireland’s ranking amongst 26 OECD countries,

Figure from page 22
Figure 4 Gross expenditure on Research and Development
(% of GDP and GNP)
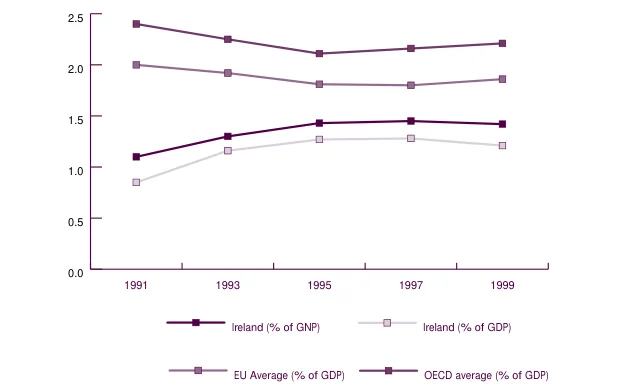
Figure 4
2.5
2.0
1.5
1.0
0.5
0.0
1991 1993 1995 1997 1999
Ireland (% of GNP) Ireland (% of GDP)
EU Average (% of GDP) OECD average (% of GDP)
Pages 21–22 · View in original PDF