Benchmarking Ireland’s performance in innovation
New indicators from the OECD Science, Technology and Industry Scoreboard can provide some comparative insights into innovation-led job creation in Ireland. Ireland has a strong specialisation in information-based industries and is the OECD’s leading exporter of IT services. Information and communication activities together represent almost 12% of Ireland’s total value added (Figure 1), against an OECD average of around 6%. Indeed, employment has held up
relatively strongly in Ireland’s ICT sector, standing 14.8% higher in Q3 2013 than in Q1 2007 7 (see also Chapter 2, Figure 2 for comparative performance during the 2011-2012 period).
as a percentage of total value added
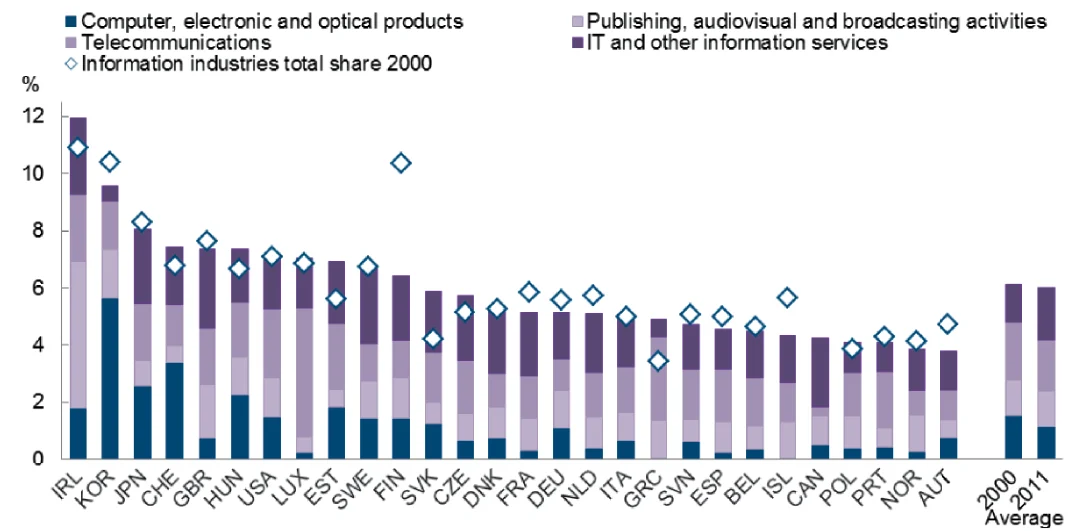
Figure 1. Information industries in OECD economies, 2000 and 2011
Source: OECD (2013), OECD Science, Technology and Industry Scoreboard 2013: Innovation for Growth, OECD Publishing, Paris. www.oecd.org/sti/scoreboard.htm
Although it has risen substantially over the past decade (Figure 2), Ireland still has relatively low business expenditure on R&D relative to GDP (1.2%), which is not due to the structural composition of the business sector itself. If Ireland had the same industrial structure as the average of OECD countries, its R&D intensity would not be much different from its current level. Services account for nearly 60% of total business R&D, mostly in information, communication and R&D services. Low- and medium- to low-technology manufacturing account for almost half of business R&D in manufacturing.
Much of the R&D in the business sector is performed by foreign-controlled affiliates. This reached 70% of the total in 2009, the highest level for the countries for which such data are available. Around 25% of the funding for business R&D comes from abroad. This includes R&D undertaken by subsidiaries of foreign-owned companies, as well as on behalf of companies based abroad. Almost 40% of the patents filed in Ireland over 2009-2011 had “inventors” from other countries and were mostly filed by firms in the business services sector. Almost 30% of Irish PCT filings relate to pharmaceutical patents and medical technologies.
Central Statistics Office Quarterly National Household Survey seasonally adjusted sectoral data.
Over the period 2006-11, Ireland has considerably increased its tax incentives for business R&D. In 2011 these approached over 70% of total government financial support for business R&D, up from about 50% in 2006 (Figure 3). The R&D tax credit was reviewed by the Department of Finance in 2013 and is generally considered to be well designed and efficient in supporting business R&D. Ireland’s broader tax environmentis also likely to play a role in the location of intellectual property. By contrast, direct government funding of business R&D in Ireland lags behind many competitor countries. Recent OECD work has found that direct support – contracts, grants and awards for mission-oriented R&D – can also be effective for stimulating R&D, particularly for young firms that lack the upfront funds for innovation. A well-designed, competitive and transparent system of direct support measures can be complementary to the use of R&D tax incentives as it may direct public funding to areas of high social returns, and help address specific barriers in the innovation system. This is perhaps something that could be addressed in future APJs as fiscal constraints become less acute. In the interim, efforts to encourage strong take-up by Irish firms of EU Horizon 2020 funding, as foreseen in APJ 2013, are a step in the right direction.
as a percentage of GDP
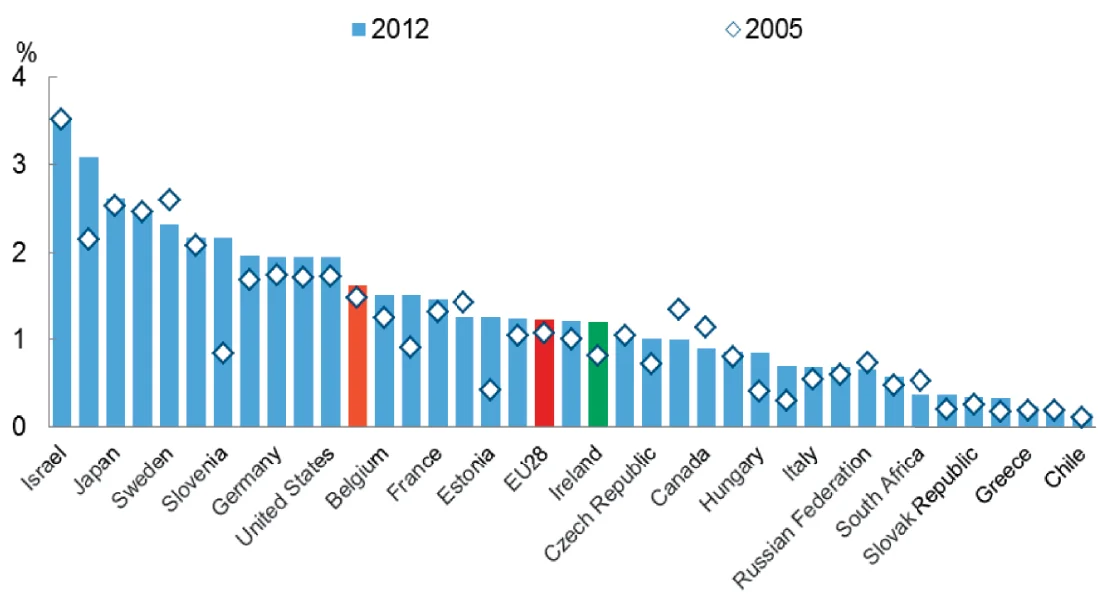
Figure 2. Business expenditure on R&D, 2005 and 2012
Source: OECD, Main Science and Technology Indicators Database, www.oecd.org/sti/msti.htm, December 2013.
as a percentage of GDP
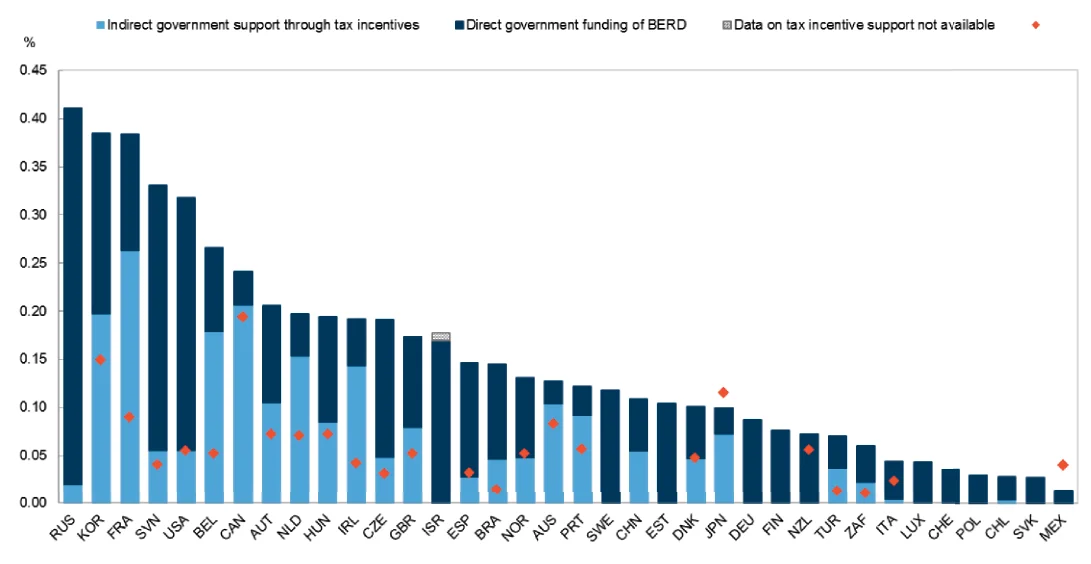
Figure 3. Direct government funding of business R&D and tax incentives for R&D, 2011
Note: This is an experimental indicator. International comparability may be limited.
Source: OECD (2013), OECD Science, Technology and Industry Scoreboard 2013: Innovation for Growth, OECD Publishing, Paris.
In addition to a favourable environment for entrepreneurs to set up businesses, Ireland has benefited from a relatively skilled workforce. Graduates at the doctorate level are considered as best qualified for knowledge creation and diffusion and also play an important role for a country’s innovative performance. Graduation rates at the doctorate level in Ireland have doubled since 2000 and remain today above the OECD average of 1.6% (Figure 4). Women account for almost half of all graduates. Almost 50% of all students at the doctorate level graduated in sciences and engineering fields (Figure 5).
Figure 4. Graduation rates at doctorate level, 2000 and 2011
as a percentage of population in the reference age cohort
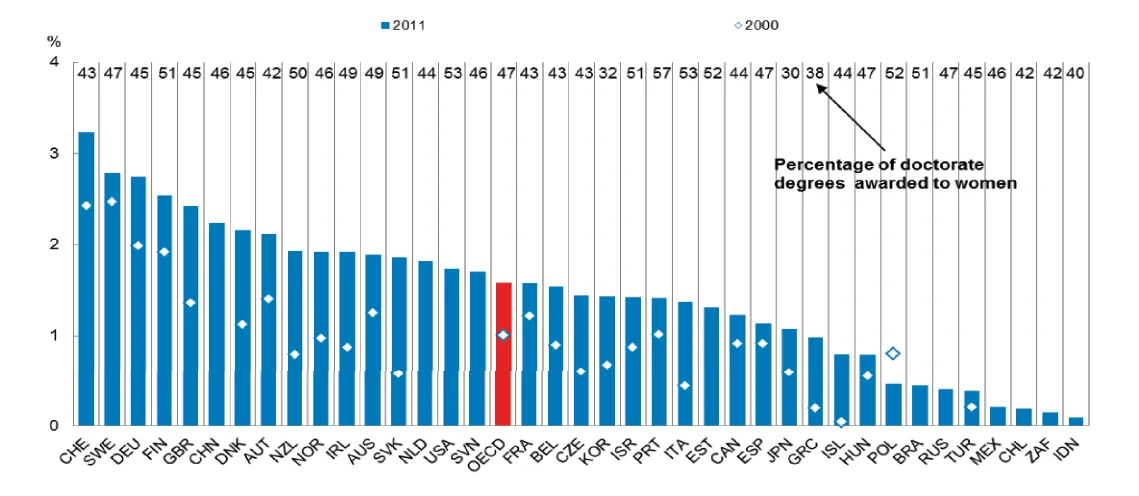
Figure 5. Graduates at doctorate level, 2011
Source: OECD (2013), OECD Science, Technology and Industry Scoreboard 2013: Innovation for Growth, OECD Publishing, Paris. www.oecd.org/sti/scoreboard.htm
by field of education
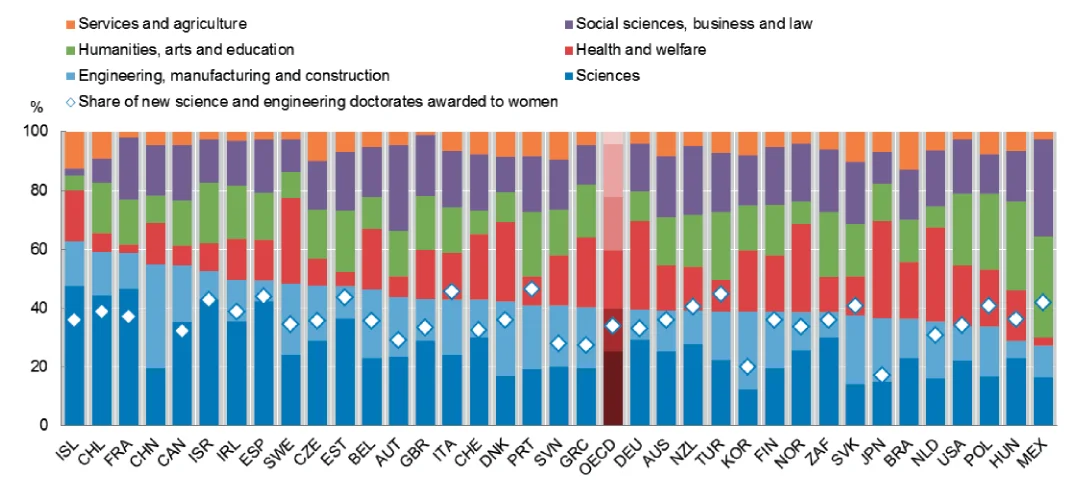
Figure 5. Graduates at doctorate level, 2011
Source: OECD (2013), OECD Science, Technology and Industry Scoreboard 2013: Innovation for Growth, OECD Publishing, Paris. www.oecd.org/sti/scoreboard.htm
Evidence shows that scientific mobility and collaboration contribute to increased scientific quality. Ireland has relatively high shares of publications involving international collaboration as well as high impact scientific publications. Over the period 1996-2011, Ireland experienced a substantial net inflow of scientists – about 35% more inflows than outflows – as revealed by changes in the affiliation of publishing scientists (Figure 6). The United Kingdom accounted for approximately half of those flows, followed by the United States (about one fourth), Canada, Australia and other large European countries. The impact of the recent crisis on these flows remains to be seen. Recognising the importance of international collaboration in science, APJ 2013 included continued work with research institutions to support collaboration eligible for international research funding.
Shares of bilateral flows in percentages by first and last affiliation – selected countries
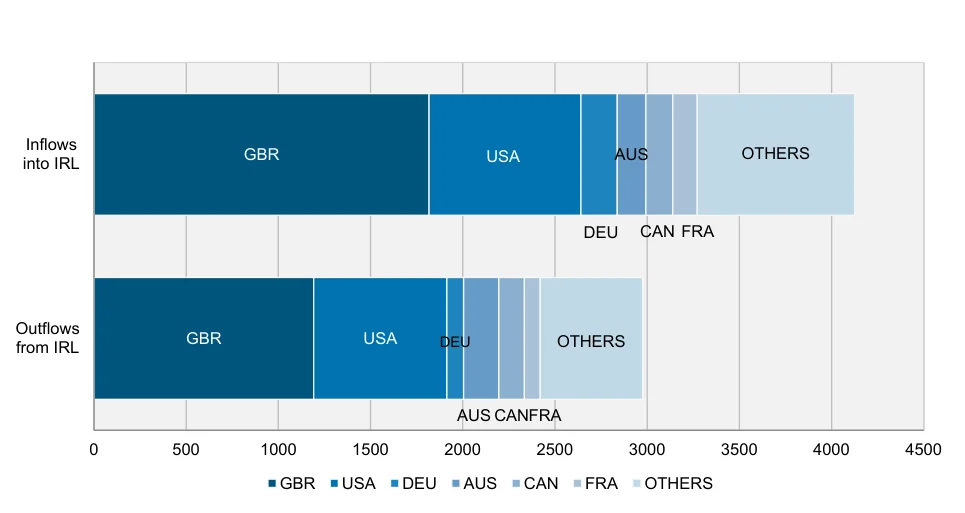
Figure 6. International flows of scientific authors, 1996-2011
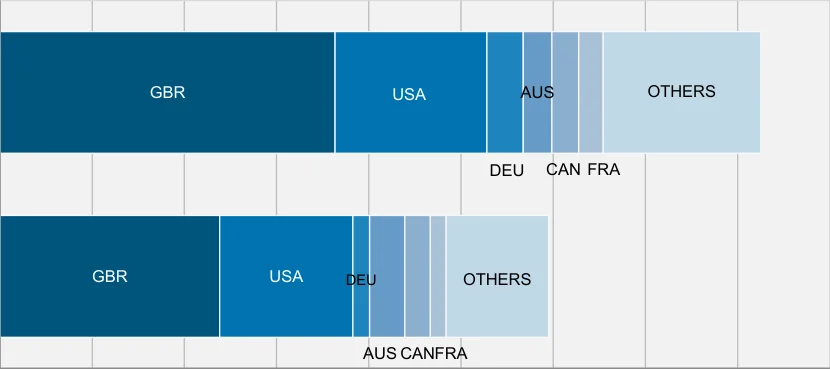
Figure 6. International flows of scientific authors, 1996-2011
Inflows into IRL
Outflows from IRL
0 500 1000 1500 2000 2500 3000 3500 4000 4500
GBR USA DEU AUS CAN FRA OTHERS
Source: OECD calculations based on Scopus Custom data, Elsevier, version 5.2102, January 2014. See also OECD (2013), OECD Science, Technology and Industry Scoreboard 2013: Innovation for Growth, OECD Publishing, Paris, www.oecd.org/sti/scoreboard.htm and Scoreboard interactive charts:www.oecd.org/sti/scoreboard-2013-interactive-charts.htm
Ensuring that quality fundamental research is translated into products and services that can be commercialised is of central importance for job creation. The establishment of a central Technology Transfer Office within Enterprise Ireland, as foreseen in APJ 2013, could make a contribution in this regard. It is important, however, to avoid a proliferation of innovation policy delivery vehicles or points of contact for entrepreneurs. If anything, existing structures are in need of streamlining. In this regard, exploring the mergers of Research Centres and Technology Centres – as foreseen in APJ 2013 – is a welcome development. It could be extended to cover a wider range of innovation policy delivery vehicles.
Pages 23–28 · View in original PDF