5.1 Energy and Environment
5.1 Energy and Environment
2030 Public Sector Targets
The Climate Action Plan 2019 set out 2030 targets for the Public Sector:
kwh/Floor Area (m2) as the EnPI (energy performance indicator) metric. Provisional results for 2021 indicate the NSSO is 7.0% better than 2020, 22.5% better than baseline and 8.5% away from the 2030 target.
• reduce CO2 equivalent emissions by 30%
• improve energy efficiency by 50%
Initiatives to improve energy efficiency in 2021 included the continued roll-out of LED lighting and energy saving sensors, as a part of an ongoing programme to improve all seven sites, in conjunction with the other tenants.
During 2021 the NSSO actively engaged with the SEAI and continued its participation in the Optimising Power @ Work Programme. The most recent status report from the SEAI stated the NSSO is more efficient than the energy efficiency baseline and is on track for the 2030 target.
The Annual Performance to Target and the improvements to carbon dioxide emissions for the two primary sites managed by the NSSO are as follows:
For the 2030 target, the NSSO has adopted
Clonskeagh Site
Annualised Performance to Target
Since the Benchmark Year
700,000
a -124,741kWh saving was seen on
600,000
500,000
site
400,000
kWh
300,000
This saving is enough to power:
200,000
30 Irish homes annually
100,000
BMY 2014 2019 2020 2021
Last 12 months Glide Path Target
218,298 miles driven by a
The Annualised Performance to Target (50% by the end of 2030 as per the glide path) involves calculation of a cumulative 12 month sum of consumption.
family car
7 Climate Action Plan 2019
National Shared Services Office (NSSO)
Carbon dioxide emissions – Clonskeagh
Compared to the base year of 2014 the carbon emissions over the last twelve months have reduced by 22%.
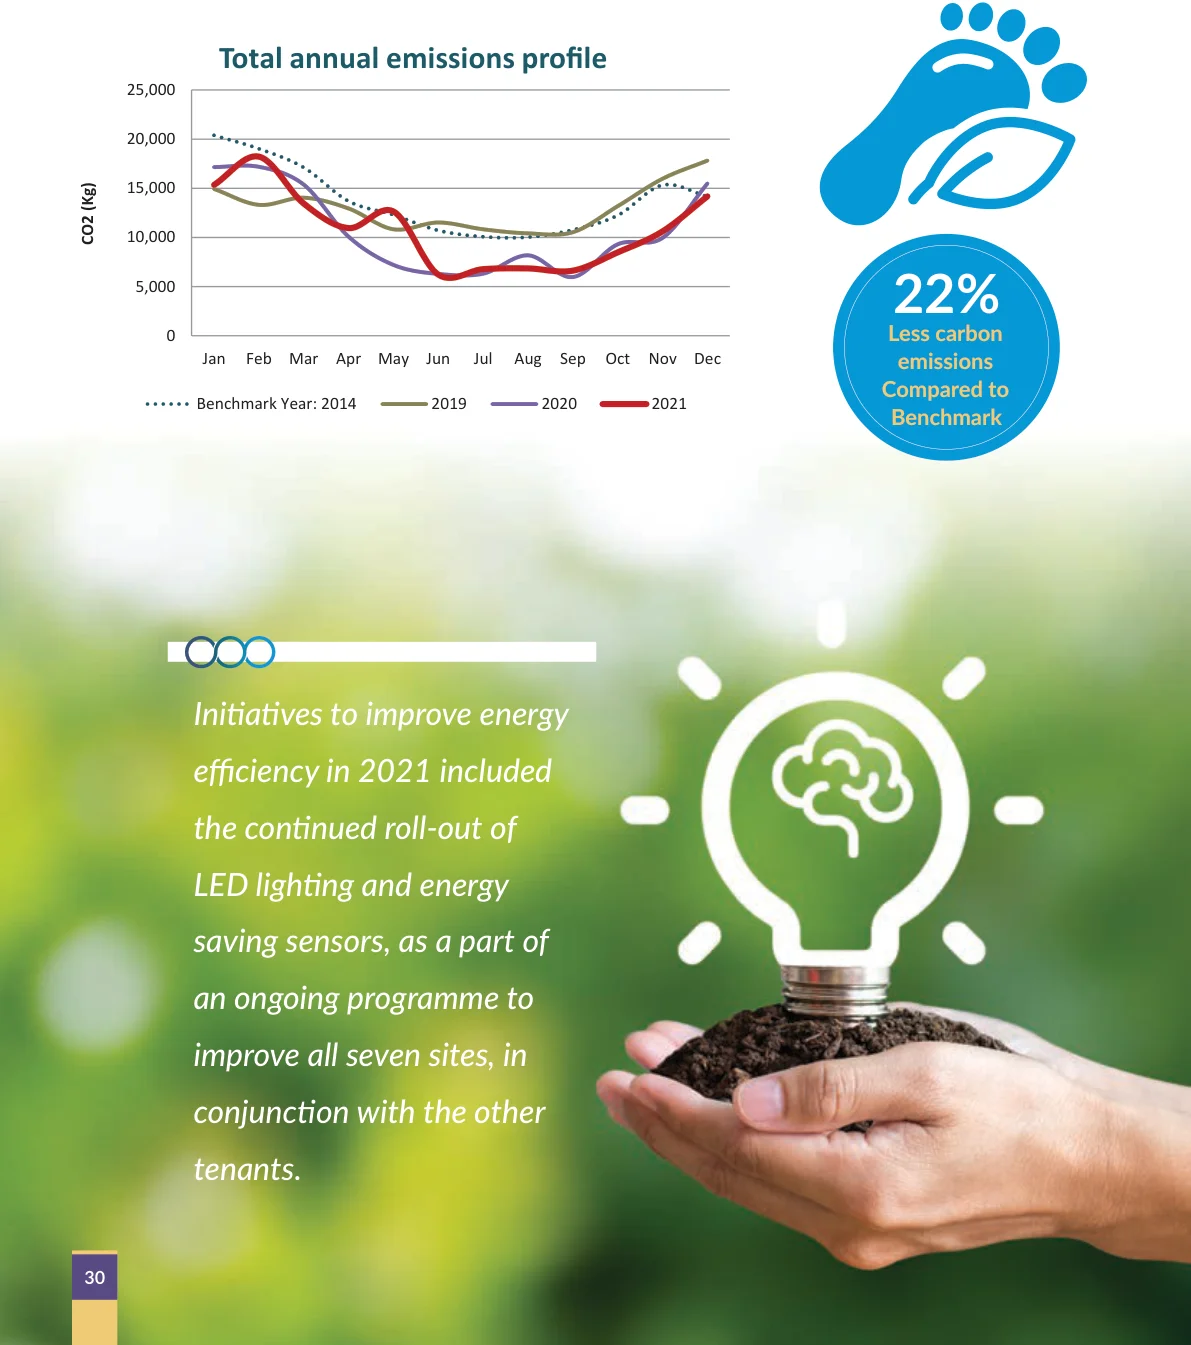
Figure from page 32
Total annual emissions profile
25,000
20,000
15,000
)g K ( 2 O C
10,000
22% Less carbon
5,000
0
emissions Compared to
Jan Feb Mar Apr May Jun Jul Aug Sep Oct Nov
Benchmark Year: 2014 2019 2020 2021
Benchmark
Initiatives to improve energy
efficiency in 2021 included
the continued roll-out of
LED lighting and energy
saving sensors, as a part of
an ongoing programme to
improve all seven sites, in
conjunction with the other
tenants.
Annual Report 2021
Tullamore Site
Since the Benchmark Year
Annualised Performance to Target
a -40,048kWh saving was seen
700,000
on site
600,000
500,000
400,000
This saving is enough to power:
kWh
300,000
10 Irish homes annually
200,000
100,000
BMY 2012 2019 2020 2021
Last 12 months Glide Path Target
70,083 miles driven by a
The Annualised Performance to Target (50% by the end of 2030 as per the glide path) involves calculation of a cumulative 12 month sum of consumption.
family car
Carbon dioxide emissions – Tullamore
Compared to the base year of 2012 the carbon emissions over the last twelve months have reduced by 10%.
Total annual emissions profile
20,000 18,000 16,000 14,000 12,000 10,000 8,000 6,000 4,000 2,000 0
)g K ( 2 O C
10% Less carbon
emissions Compared to
Jan Feb Mar Apr May Jun Jul Aug Sep Oct Nov Dec
Benchmark Year: 2012 2019 2020 2021
Benchmark
A part of an OPW initiative to improve and further reduce the energy consumption/carbon dioxide emissions, the Tullamore site has been selected for full deep energy retrofit, with a feasibility study due to commence in March 2022.
National Shared Services Office (NSSO)
NSSO Locations
Payroll Services, Finance Services, Corporate Services
(Galway)
Payroll Services
(Killarney: Deerpark and
New Road)
Annual Report 2021
Pages 31–35 · View in original PDF