Religion and ethnicity
There were substantial changes in religious affiliation between the 2011 and 2022
Census. For children aged 0-4 years specifically, the percentage described as ‘Roman
Catholic’ declined from 84% to 65% over time (Table 1.4). The main increase was in
the percentage with ‘no religion’ up from 5% in 2011 to 16% in 2022; and there was
also an increase in the ‘not stated’ category for this age group from 2% to 8%. Table
1.4 below shows the 2011 and 2022 percentages for all categories above 1% in 2022
but note that were was a wide range of other religious affiliations with smaller
numbers.
category was at least 1% in 2022
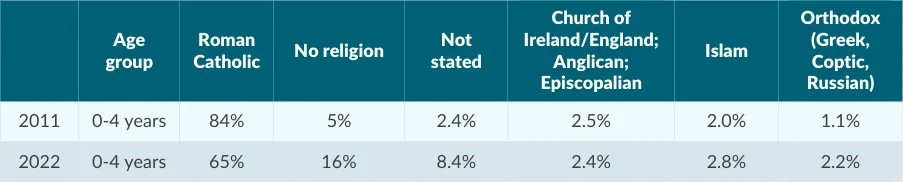
Table 1.4: Religious affiliation for children aged 0-4 years in 2011 and 2022, where the percentage for a particular
Source: CSO Table F5701
Ireland was the place of birth for 80% of the entire usually resident population in
2022 – down somewhat from 83% in the 2011 Census (Table FY016). The next most
common place of birth was England and Wales (5% in 2011 and 4% in 2022). Just
over 1% of the population at both time-points gave their place of birth as Northern
Ireland. No other individual country had a representation above 1% in 2022. Over
90% of children aged 0-14 years4 were born within Ireland at both Censuses.
Although the percentage representation of any individual country of birth outside
Ireland and the UK remains small, the CSO5 notes that the biggest increases since the
2016 census - as measured by actual number of individuals - were from India, Brazil,
Romania, Ukraine and Moldova. Table 1.5 below reproduces the CSO figures (from
Figure 4.4 of that release).
showing change from 2011 census figures
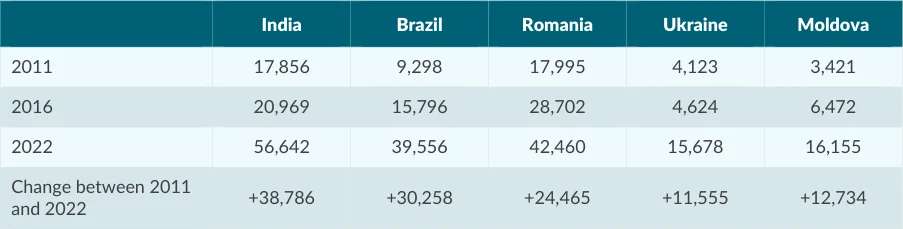
Table 1.5: Birth countries with the biggest increases in Irish population numbers between 2016 and 2022, also
Reproduced from Figure 4.4 of the CSO publication in footnote 5
The ethnicity question was updated for Census 2022, meaning that a direct
comparison with the 2011 Census is not possible. Looking just at the 2022 figures
shows that 75% of children aged 0-4 years were described as ‘White Irish’ (Table 1.6).
4 A 0-4 years breakdown was not published in the relevant table
5 https://www.cso.ie/en/releasesandpublications/ep/p-cpsr/censusofpopulation2022- summaryresults/migrationanddiversity/
The next biggest groups were ‘any other White background’ (7%) and ‘Asian or Asian
Irish – Indian/Pakistani/Bangladeshi’ (3%). Just over 1% of young children were
‘White Irish Travellers’ and less than half of one percent were ‘White Roma’.
Table 1.6: Ethnicity for children aged 0-4 years in the 2022 Census (only)
| Ethnicity in 2022 (age 0-4 years only) | % | ||||
|---|---|---|---|---|---|
| White Irish | 75.4% | ||||
| White Irish Traveller | 1.3% | ||||
| White Roma | 0.4% | ||||
| Any other White background | 7.3% | ||||
| Black or Black Irish - African | 1.3% | ||||
| Black or Black Irish - any other Black background | 0.2% | ||||
| Asian or Asian Irish - Chinese | 0.4% | ||||
| Asian or Asian Irish - Indian/Pakistani/Bangladeshi | 3.0% | ||||
| Asian or Asian Irish - any other Asian background | 0.7% | ||||
| Arab | 0.6% | ||||
| Other including mixed background | 2.3% | ||||
| Not stated | 7.2% | ||||
| All ethnicities | 292,797 (100%) |
Source: CSO Table FY023
1.3 Changing policy context
Pages 14–16 · View in original PDF