Family structures
Table 1.1 contrasts the marital status and size of all family units with children (of any
age) in the 2011 and 2022 census. The overall trends for marital status remained
relatively stable across time. For both 2011 and 2022, three-quarters of all families
with multiple children were headed by a married couple but was just over half for
families with one child. The proportion of one-parent family structures was greater in
families with one child at both time-points, and one-parent mothers were much more
common than one-parent fathers (30% vs 6% in 2022).
There was, however, a noticeable change over time in the number of children in
families with a same-sex couple (CSO Table F3068). In 2011, there were just 353
children in this family type but that increased to 1853 by 2022. Female-female
couples were predominant at both time-points.
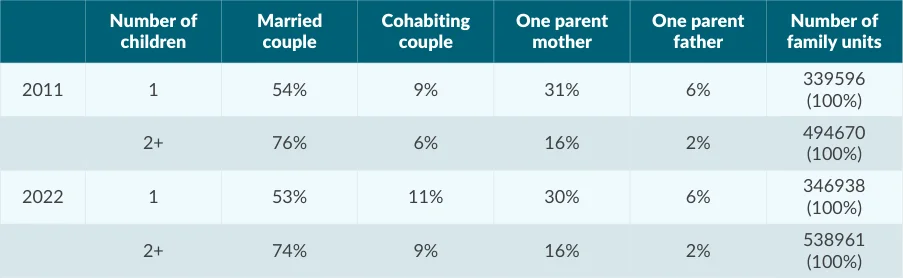
Table 1.1: Family size and marital status for all families with children in the 2011 and 2022 census
Source: CSO Table F3009
3 All table references in the format ‘F3 etc’ or ‘VSA etc’ are the original CSO data tables
Housing
Pages 12–13 · View in original PDF