3.4 Follow-through inspection findings
3.4 Follow-through inspection findings
Follow-through inspections evaluate the progress made in implementing the recommendations in the most recent early years education inspection report
Follow-through inspection of ELC settings that had a published EYEI report commenced in late 2017. These inspections evaluate the progress that an ELC setting has made in implementing actions advised to improve the quality of provision and practice across the four areas of the early years (EY) quality framework in their most recently published report arising from an EYEI.
The follow-through inspection uses the following four ratings:
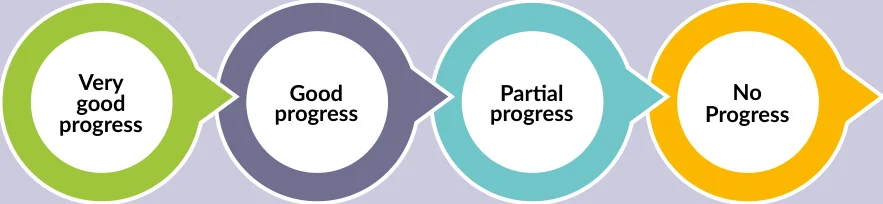
Figure 3.2: Follow-through inspection ratings in ELC settings: September 2017- December 2020
Very No Good Partial good progress progress Progress progress
Source: Inspectorate, Department of Education
In total, 195 follow-through inspections were conducted between September 2017 and the end of 2020.
In the EYEIs that were the subject of the follow-through inspections, actions were advised across all four areas of the EY quality framework (Table 3.5). The greatest number of actions advised related to Area 2, quality of the processes to support children’s learning and development. While the overall quality of provision in this area was good (91% good or better), the quality had been found to be fair in a greater percentage of settings (9%) than in any of the other areas. The least number of actions advised related to Area 4, Quality of management and leadership for learning.
Table 3.5: Number of actions advised across the four areas of the Early Years Quality Framework during follow-through inspections in ELC settings: September 2017 - December 2020
Area 1
Area 2
Area 3
Area 4
Quality of the context to support
Quality of the processes to support children’s learning and
Quality of children’s learning experiences
Quality of management and leadership
learning
and learning
development
for learning
409 553 419 369
Source: Inspectorate, Department of Education
The highest level of success was in addressing actions advised in relation to the quality of the context to support children’s learning and development; early learning and care settings were less successful in addressing improvements in the quality of management and leadership
Overall, there was good or very good progress in addressing over two-thirds of the actions advised in EYEI reports. When broken down into the four areas of the EY quality framework, the highest levels of success in addressing actions advised were in Area 1, Quality of the context to support children’s learning and development. In this area, good progress or better was made in progressing 81% of the actions advised (Table 3.6).
Making improvements in Area 4, quality of management and leadership for learning, provided a greater challenge for settings; good or very good progress was made in 60% of the actions advised, with partial or no progress made in 40% of them. The establishment of review processes to support self-evaluation emerged frequently as an area in which settings had made partial or no progress. The involvement of parents in the process of internal setting review and, more generally, as active partners in their children’s learning, was also an area requiring further development in many settings. Another area in which progress was limited was in the establishment of relationships with primary schools to facilitate positive transitions for children.
From a curriculum perspective, the findings from follow-through inspections indicate that further work is required in differentiating the curriculum or programme of activities to take account of children’s strengths, needs and interests. Also, the enrichment of outdoor play and learning environments was recommended frequently as an area requiring further follow-up.
Table 3.6: Follow-through inspections in ELC settings- Progress in implementing the actions advised by inspectors: September 2017 - December 2020
| Area 1 | Area 2 | Area 3 | Area 4 | |
|---|---|---|---|---|
| Very good progress | 57.4% | 35.2% | 42.3% | 32.8% |
| Good progress | 23.5% | 34.5% | 29.8% | 27.1% |
| Partial progress | 15.4% | 25.1% | 22.9% | 22.8% |
| No progress | 3.7% | 5.2% | 5.0% | 17.3% |
Source: Inspectorate, Department of Education
Pages 99–100 · View in original PDF