• Tourist Routes
Figure 3.1: Interurban route selection methodology
Step 1: Population Centres
For each county, populations centres and urban settlements defined by the CSO were identified. This would allow initial connection points to be established between each major town and identify potential cycle desire lines. To better categorise these locations, there population areas were broken into the following tranches.
Major cities and towns (5,000+ inhabitants)
Towns (1000-4,999 inhabitants)
Villages of note (500-999 inhabitants)
This has resulted in 57 towns and cities with at least 5,000 inhabitants being identified outside the GDA. At least 150 towns with a population of at least 1,000 were also identified. Priority was given to connections between towns and cities of at least 1,000 inhabitants. This would allow a sufficiently dense network of connections to be established in each county as part of developing the CCN.
Step 2: Link Selection
Once the base populations in each county have been established, the route between each town was selected. On the routes chosen outside urban areas, there are roads with speed limits of more than 60kph, where cyclists are likely to mix with traffic, the selection of interurban links looked to prioritise safety. Based on previous research, a hierarchy for link selection was established whereby safety was the priority when selecting the preferred link with subsequent
criteria of directness, connectivity and accessibility used to refine the specific routing of the interurban links. Figure 3.2 below shows an outline of this hierarchy with the four criteria explained subsequently.
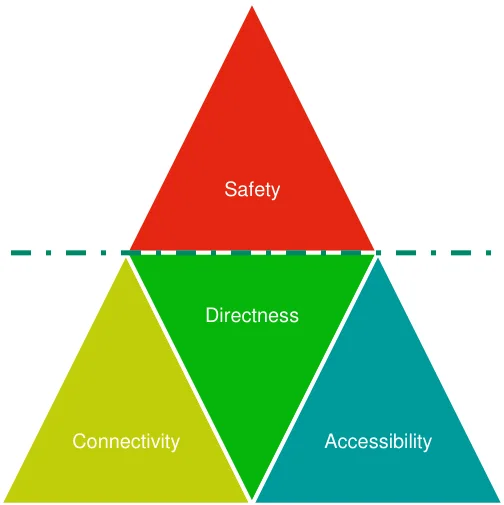
Figure 3.2: Hierarchy of route design factors
Safety
Directness
Connectivity
Accessibility
Safety: When presented with multiple route choices between two or more locations, the route that is safest or with the potential to be developed into a safe cycle route will be considered as the initial preferred route. This typically involved avoiding roads with higher speeds, poor forward visibility or which showed low potential to be upgraded in the future. Other safety issues to consider will be ensuring routes with sufficient forward visibility so that cyclists can be seen at all times and ensuring adequate stopping distance for vehicles. Thus, roads with excessive bends will be avoided as much as possible. Additional safety issues will be personal safety of each cyclist such as providing routes along areas with natural surveillance and public lighting where possible.
Directness: Preferred routes between destination will be as direct as possible. However, where a safer route is slightly longer and follows a relatively direct route between destinations, the direct route will be the second factor to be considered.
Connectivity: Where possible, the interurban route will look to link as many communities, settlements and services as possible along an interurban route. This will include all small villages, schools, sports clubs and any particular tourist attractions.
Accessibility: This will include avoidance of excess gradients where possible. There may be some short sections where excess gradient will be unavoidable requiring some additional infrastructure works in the future. Google mapping has been used to informally check if certain routes have excessive gradient and if any flatter routes were nearby. Figure 3.3 below provides an example of this where a flatter route is available but over a slightly longer distance.
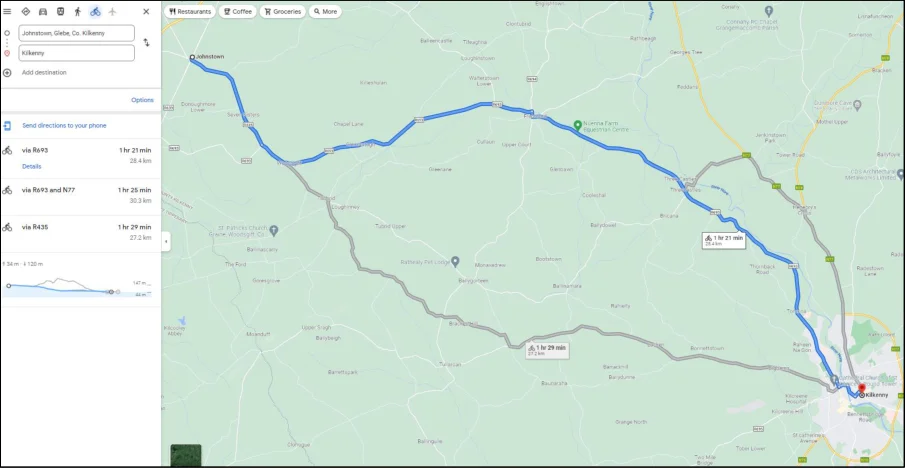
Figure 3.3: Example of flatter yet slightly longer route being selected ( ©Google 2022)
Step 3: Link Coherence & Classification
Once the specific interurban link has been selected, it will then be given a classification. Table 3.1 below outlines the four cycle route classifications considered for the CycleConnects cycle network. Urban Primary and Secondary routes will be confined to large urban areas with a population greater than 5,000 people. The interurban links will form the majority of route types outside these urban areas. Any feeder links used to connect to mainline interurban links will also be classified as an interurban link. Any existing or proposed greenways/blueways will also be considered when developing the interurban links and if they are connected as part of a coherent network. This mirrors the classifications in the GDA Cycle Network.
Table 3.1: CCN Route Classifications
| Name | Function | ||||
|---|---|---|---|---|---|
| Urban Primary | High quality cycle route that can accommodate a high volume of cyclists typical in most urban areas. These will look to feature on major desire lines in town centres and form distinctive radial and orbital cycle routes in the major towns and cities. These primary routes should also form a cohesive and connected network within the urban area that will be simple for all types of cyclists to navigate. | ||||
| Urban Secondary | Second tier cycle route in major urban areas to link with urban primary network to add greater route density and options on the network. These will typically be passing through residential areas, school and employment areas | ||||
| Interurban | On-road cycle route to link all key settlements and destinations outside urban areas. These may have potential to provide off-road/segregated routes parallel to the existing road in later years. | ||||
| Greenway | Off-road cycle route with no adjacent traffic for the majority of its route. These are typically located on old rail trails or Blueways (routes along rivers, lakes and canals) with cyclists sharing the route with pedestrians. |
GIS Network
Prior to developing the Cycle Networks for each county, a GIS model was established for each county. This model included the existing information available for the county, supplied by various bodies such as including the NTA, CSO, Department for Transport, Department for Education and various County Councils. The data collected includes:
Locations of major employment and job density
Existing cycle infrastructure and routes
Existing bus stops, rail lines and other public transport
Location of minor, serious and fatal road collisions
Shopping centres, hospitals and other destinations that may attract cyclists
The collation of this data has aided the selection of routes and allowed for maximised population figures to be serviced by these proposed cycle routes. It has also allowed for the servicing of key destinations. As the network developed in each county, these GIS maps were then combined to form one large national GIS map showing all cycle routes connecting all counties together.
Pages 5–8 · View in original PDF